Open an Example Capture
The quickest way to get a feel for EmbedStudio: open the example that comes with it and look at real firmware data. It works without registering anywhere.
Before you start: EmbedStudio installed and started. No registration, account, license, probe or ELF file needed: opening a capture works in the unlicensed Viewer.
1.Find the example
The EmbedStudio download includes a folder named examples, next to the EmbedStudio executable. You do not have to browse to it: the file dialogs in the next steps open there the first time.
- examples/workspaces/es_example_01.esws is the workspace: the dashboards and plots the example was recorded with.
- examples/captures/es_example_01.hdf5 is the capture: the recorded firmware data itself.
Opening an example needs no registration and no license. Capturing variables from your own target does: that takes the free license, which you get after registering (the next guide).
2.Open the example workspace
Open the workspace first, so the recording has its plots to appear in.
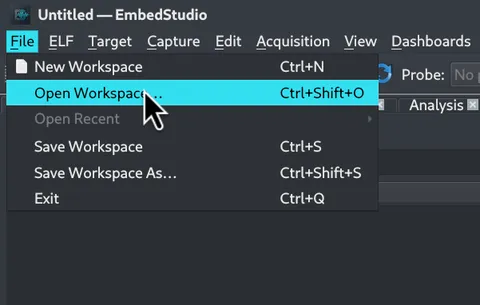
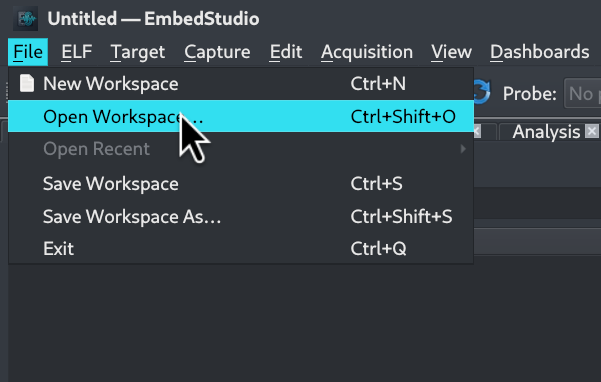
2.1Choose File → Open Workspace…
Or press Ctrl+Shift+O.
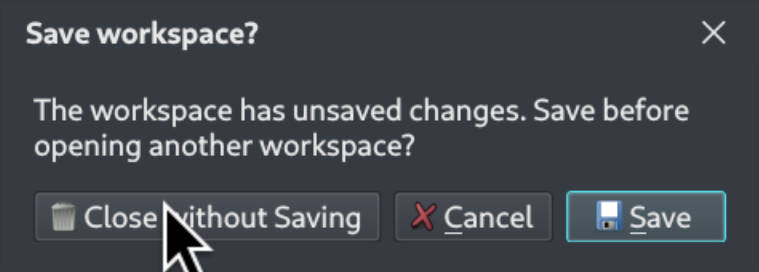
2.2Discard the empty workspace if asked
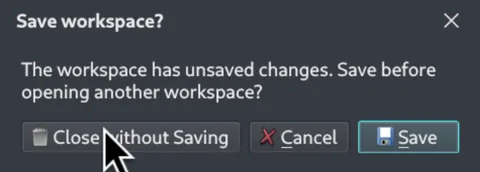
If EmbedStudio asks whether to save the current workspace, choose Close without Saving. A workspace you have not changed has nothing worth keeping.
2.3Select es_example_01.esws
The dialog opens in the examples/workspaces folder. Select the file and press Open.
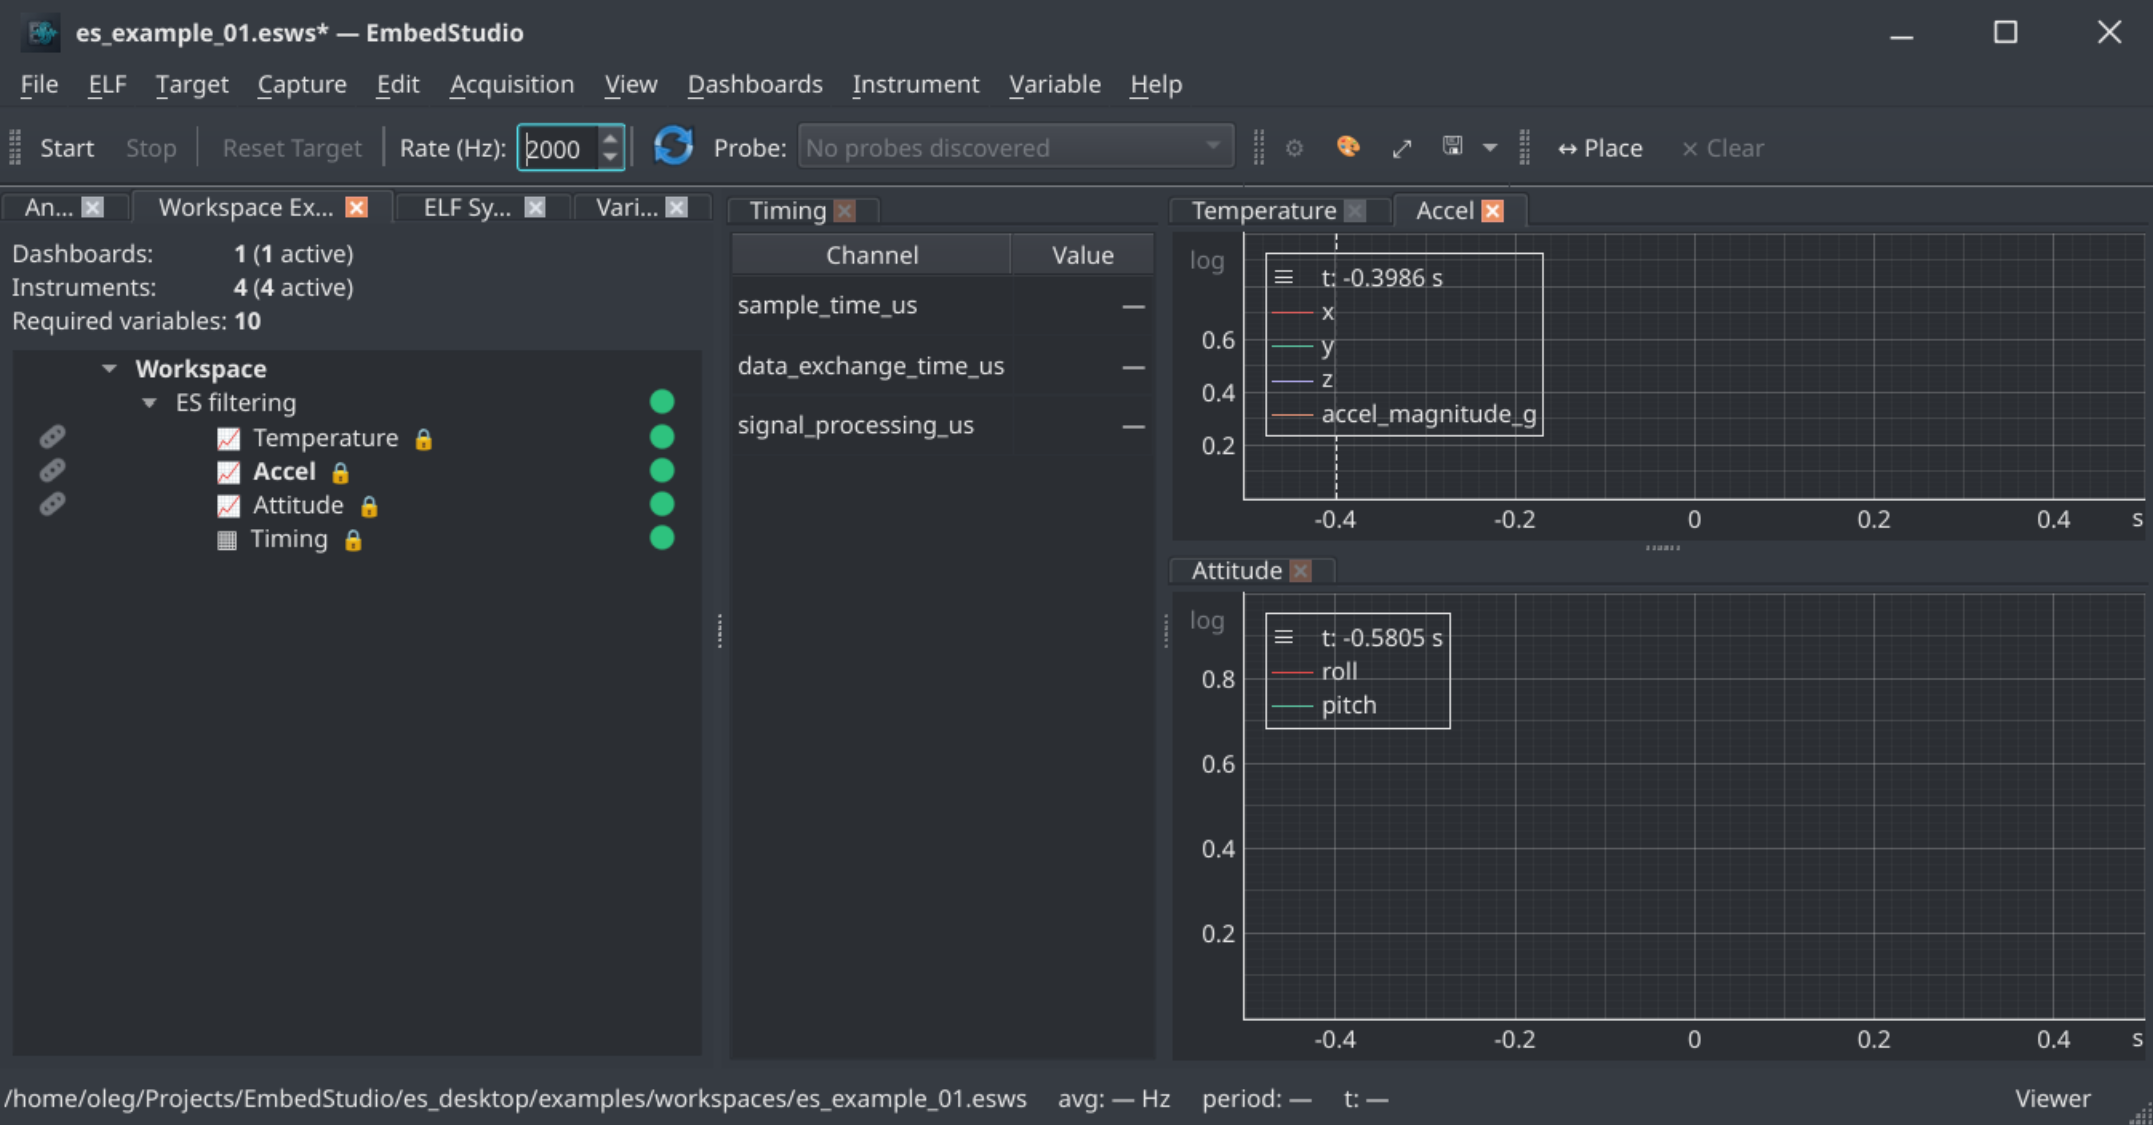
2.4See the empty dashboard
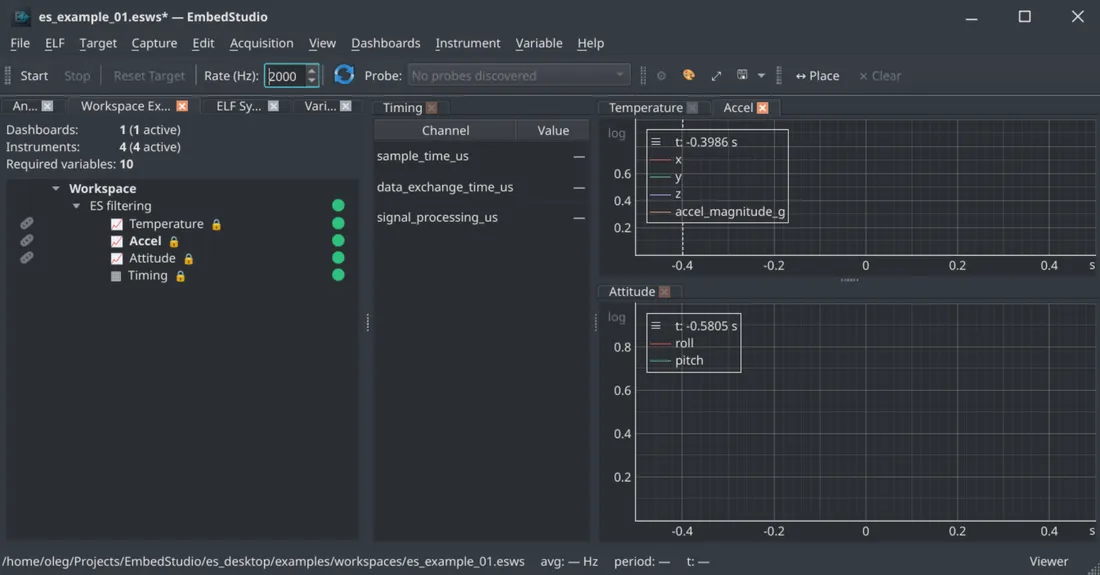
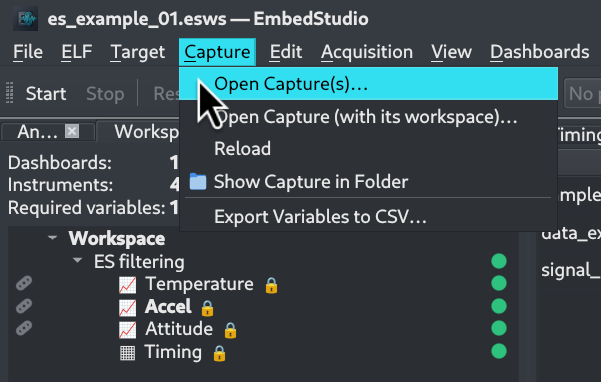
The workspace explorer now lists the example’s instruments: the plots Temperature, Accel and Attitude and a table named Timing. They are empty, because no data has been loaded yet.
3.Open the sample capture
Now load the recording into those plots.
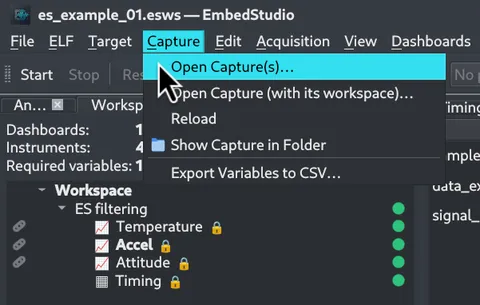
3.1Choose Capture → Open Capture(s)…
The same menu also offers Reload, Show Capture in Folder and Export Variables to CSV….
3.2Select es_example_01.hdf5
The dialog opens in the examples/captures folder. Select the file and press Open.
4.Look around
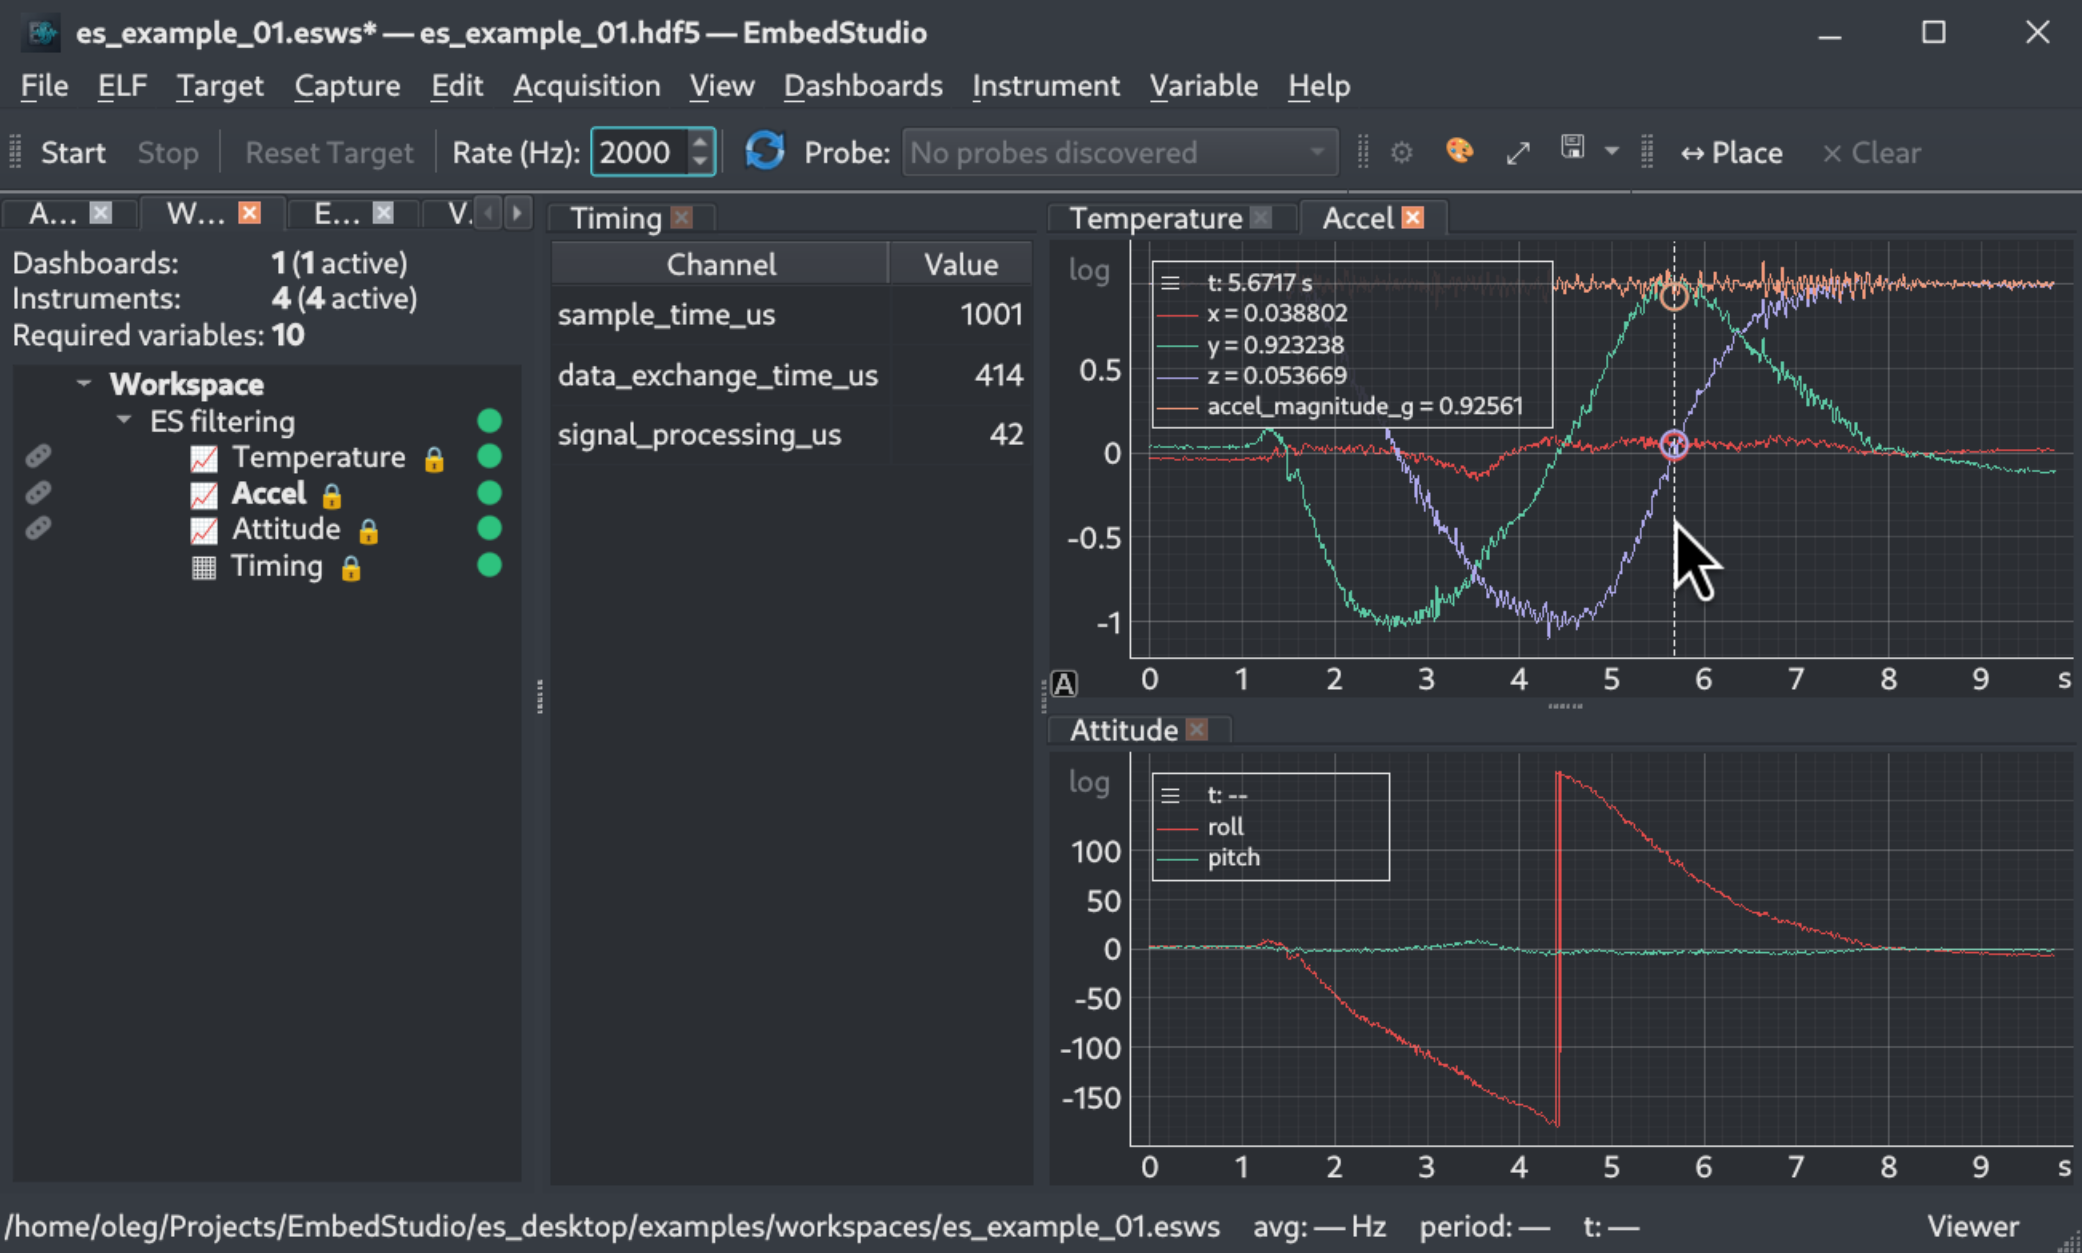
The plots fill with the recorded signals and the table shows their values. The example is a ten-second recording from an inertial sensor.
- The Accel plot draws the three accelerometer axes and their magnitude.
- The Attitude plot draws roll and pitch.
- The Timing table lists the firmware’s timing figures (sample time, data exchange time, signal processing time) in microseconds.
- Move the mouse over a time plot: its legend reads out every channel’s value at the cursor.
The status bar still reads Viewer. Without a license EmbedStudio can open, view, measure and export a recording to CSV, which is everything this guide used. It cannot create instruments or acquire from a target; that takes the free license, available after registration, which the next guide sets up.