
Runtime Variable Tracing
Extract firmware symbols from ELF files and observe live variables without adding intrusive instrumentation.
EmbedStudio is a lightweight debugging and visualization platform for embedded firmware developers. Trace runtime variables, inspect system behavior, and understand your firmware in real time.
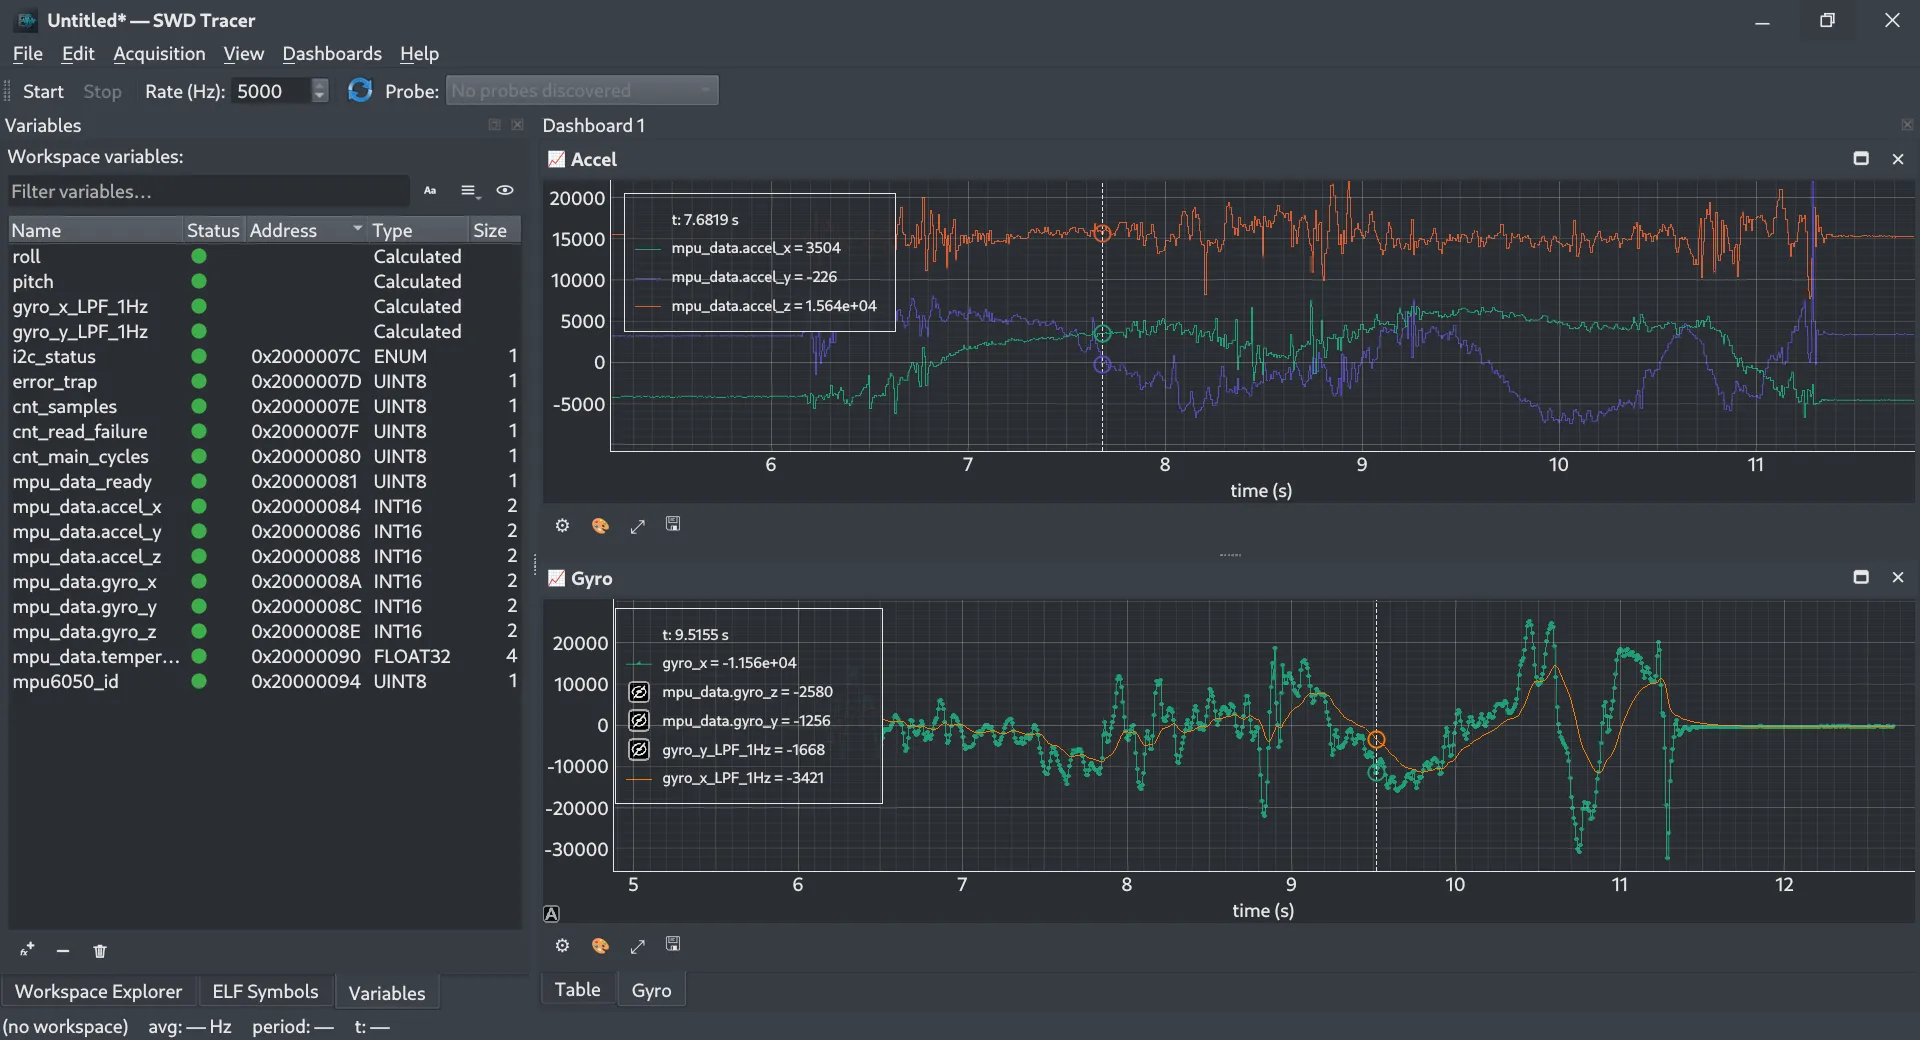
Everything EmbedStudio does is aimed at understanding running firmware while leaving its timing and behavior intact.
Extract firmware symbols from ELF files and observe live variables without adding intrusive instrumentation.
Transform embedded runtime data into meaningful plots and dashboards.
Use SWD-based observation to minimize impact on system behavior.
Designed for firmware developers working with real embedded hardware.
From control loops to sensor bring-up, EmbedStudio gives you a live window into the values that matter.
Analyze current, torque, velocity and controller behavior.
Visualize IMU, ADC and communication data.
Understand what firmware is doing while it is running.
EmbedStudio speaks the tools and standards firmware teams already use — no vendor lock-in, no custom agents running on your target.
EmbedStudio is a lightweight debugging and visualization platform for embedded firmware developers. It traces runtime variables from your microcontroller and turns live embedded data into real-time plots and dashboards, so you can understand system behavior without changing it.
EmbedStudio reads symbol information from your firmware ELF file using DWARF debug data, then observes the corresponding variables directly from device memory over an SWD debug connection. This low-intrusion approach requires no printf logging or added instrumentation, so firmware timing and behavior stay intact.
EmbedStudio targets ARM Cortex-M microcontrollers, including the STM32 family. Any MCU reachable over SWD with standard ELF/DWARF debug symbols fits the workflow.
No. EmbedStudio observes existing variables through the debug interface instead of injecting logging code. You do not need to modify your firmware or add intrusive instrumentation to trace runtime values.
EmbedStudio uses SWD (Serial Wire Debug) to read live memory and variables from ARM Cortex-M targets, the same interface used by common in-circuit debuggers on STM32 hardware.