
Capture a Variable
Connect a supported target, load your firmware and watch a variable in real time.
Before you start: EmbedStudio installed; the Free license installed (see Activate the Free License); a supported debug probe with its drivers installed (on Linux, the USB access rules for the probe); and a firmware ELF file with debug information, built from the firmware that is flashed on the target.
1.Connect a Supported Debug Probe
Connect a debug probe between your computer and the target board. EmbedStudio talks to the chip over SWD.
- Your computerRuns EmbedStudio
- Debug probeST‑Link, J‑Link or CMSIS‑DAP
- Target MCURuns your firmware
The probe must be usable by the operating system before EmbedStudio can see it: install its drivers first. On Linux that means the USB access rules for the probe. Which probes and targets have actually been run is listed on the Hardware page; anything not listed there has not been verified.
2.Build Firmware with Debug Information
EmbedStudio reads variable names, addresses and types from the firmware ELF file. That needs the DWARF debug information the compiler emits when debug info is enabled (for GCC, the -g option).
- Load the ELF produced by your build, not the .bin or .hex.
- Variables the optimizer removed or folded into constants have no address to read.
- Flash that same build onto the target with your usual tool before you start acquisition. EmbedStudio reads the memory of firmware that is already running on the chip; it does not load the firmware for you.
3.Load Your Firmware ELF
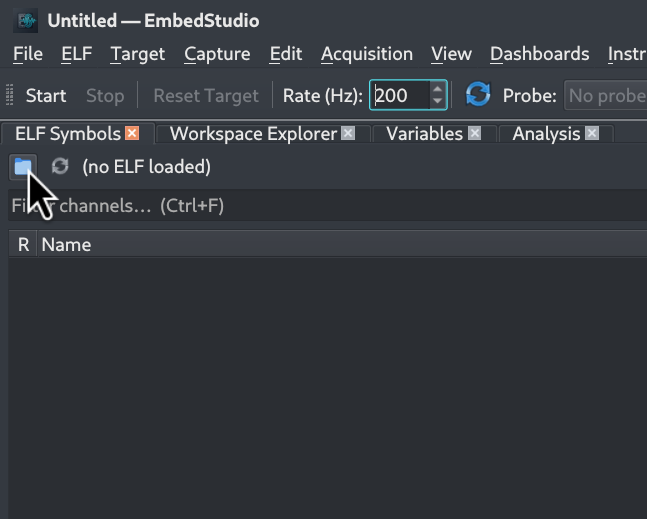
In the ELF Symbols panel, press the folder button at its top left, or choose ELF → Load ELF… (Ctrl+O), and select the .elf file your build produced.
4.Make Sure the ELF Carries Debug Information
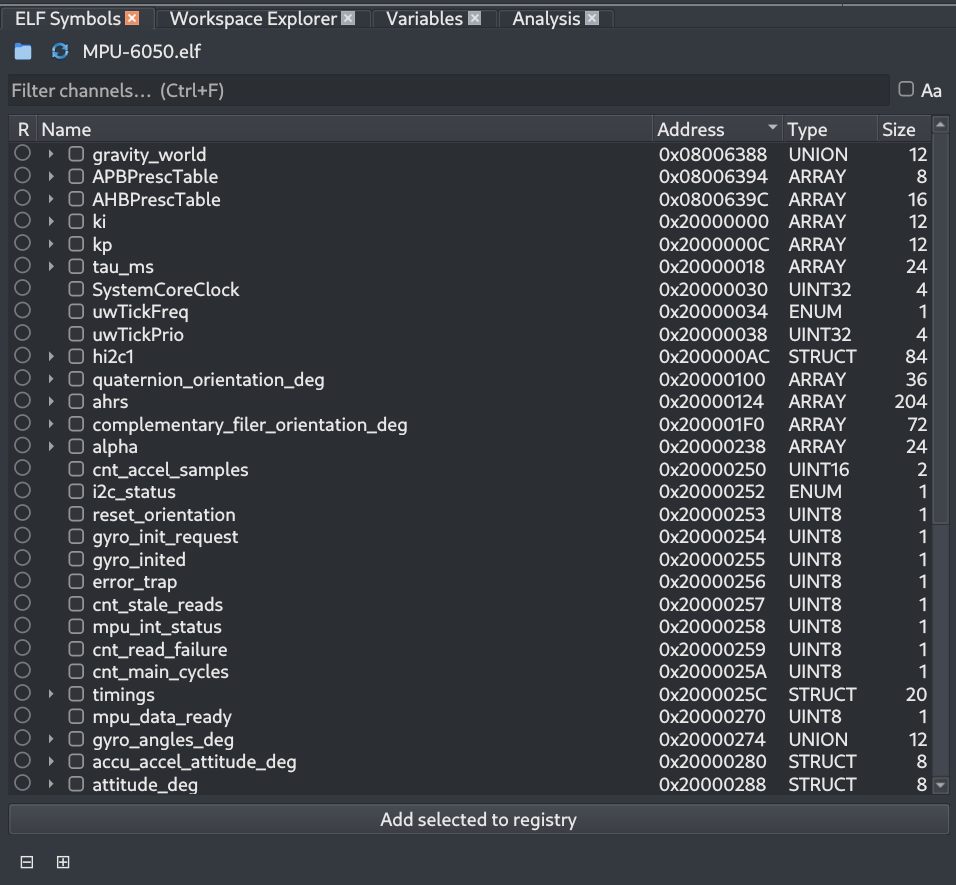
The panel now names the file and fills with the variables found in it, each with its address, type and size. A populated list means the debug information is there. Use the filter box to find a variable by name.
If nothing is listed, the ELF has no DWARF data: rebuild the firmware with -g and load it again. ELF → ELF Information says so as well.
5.Put Variables on the Plot
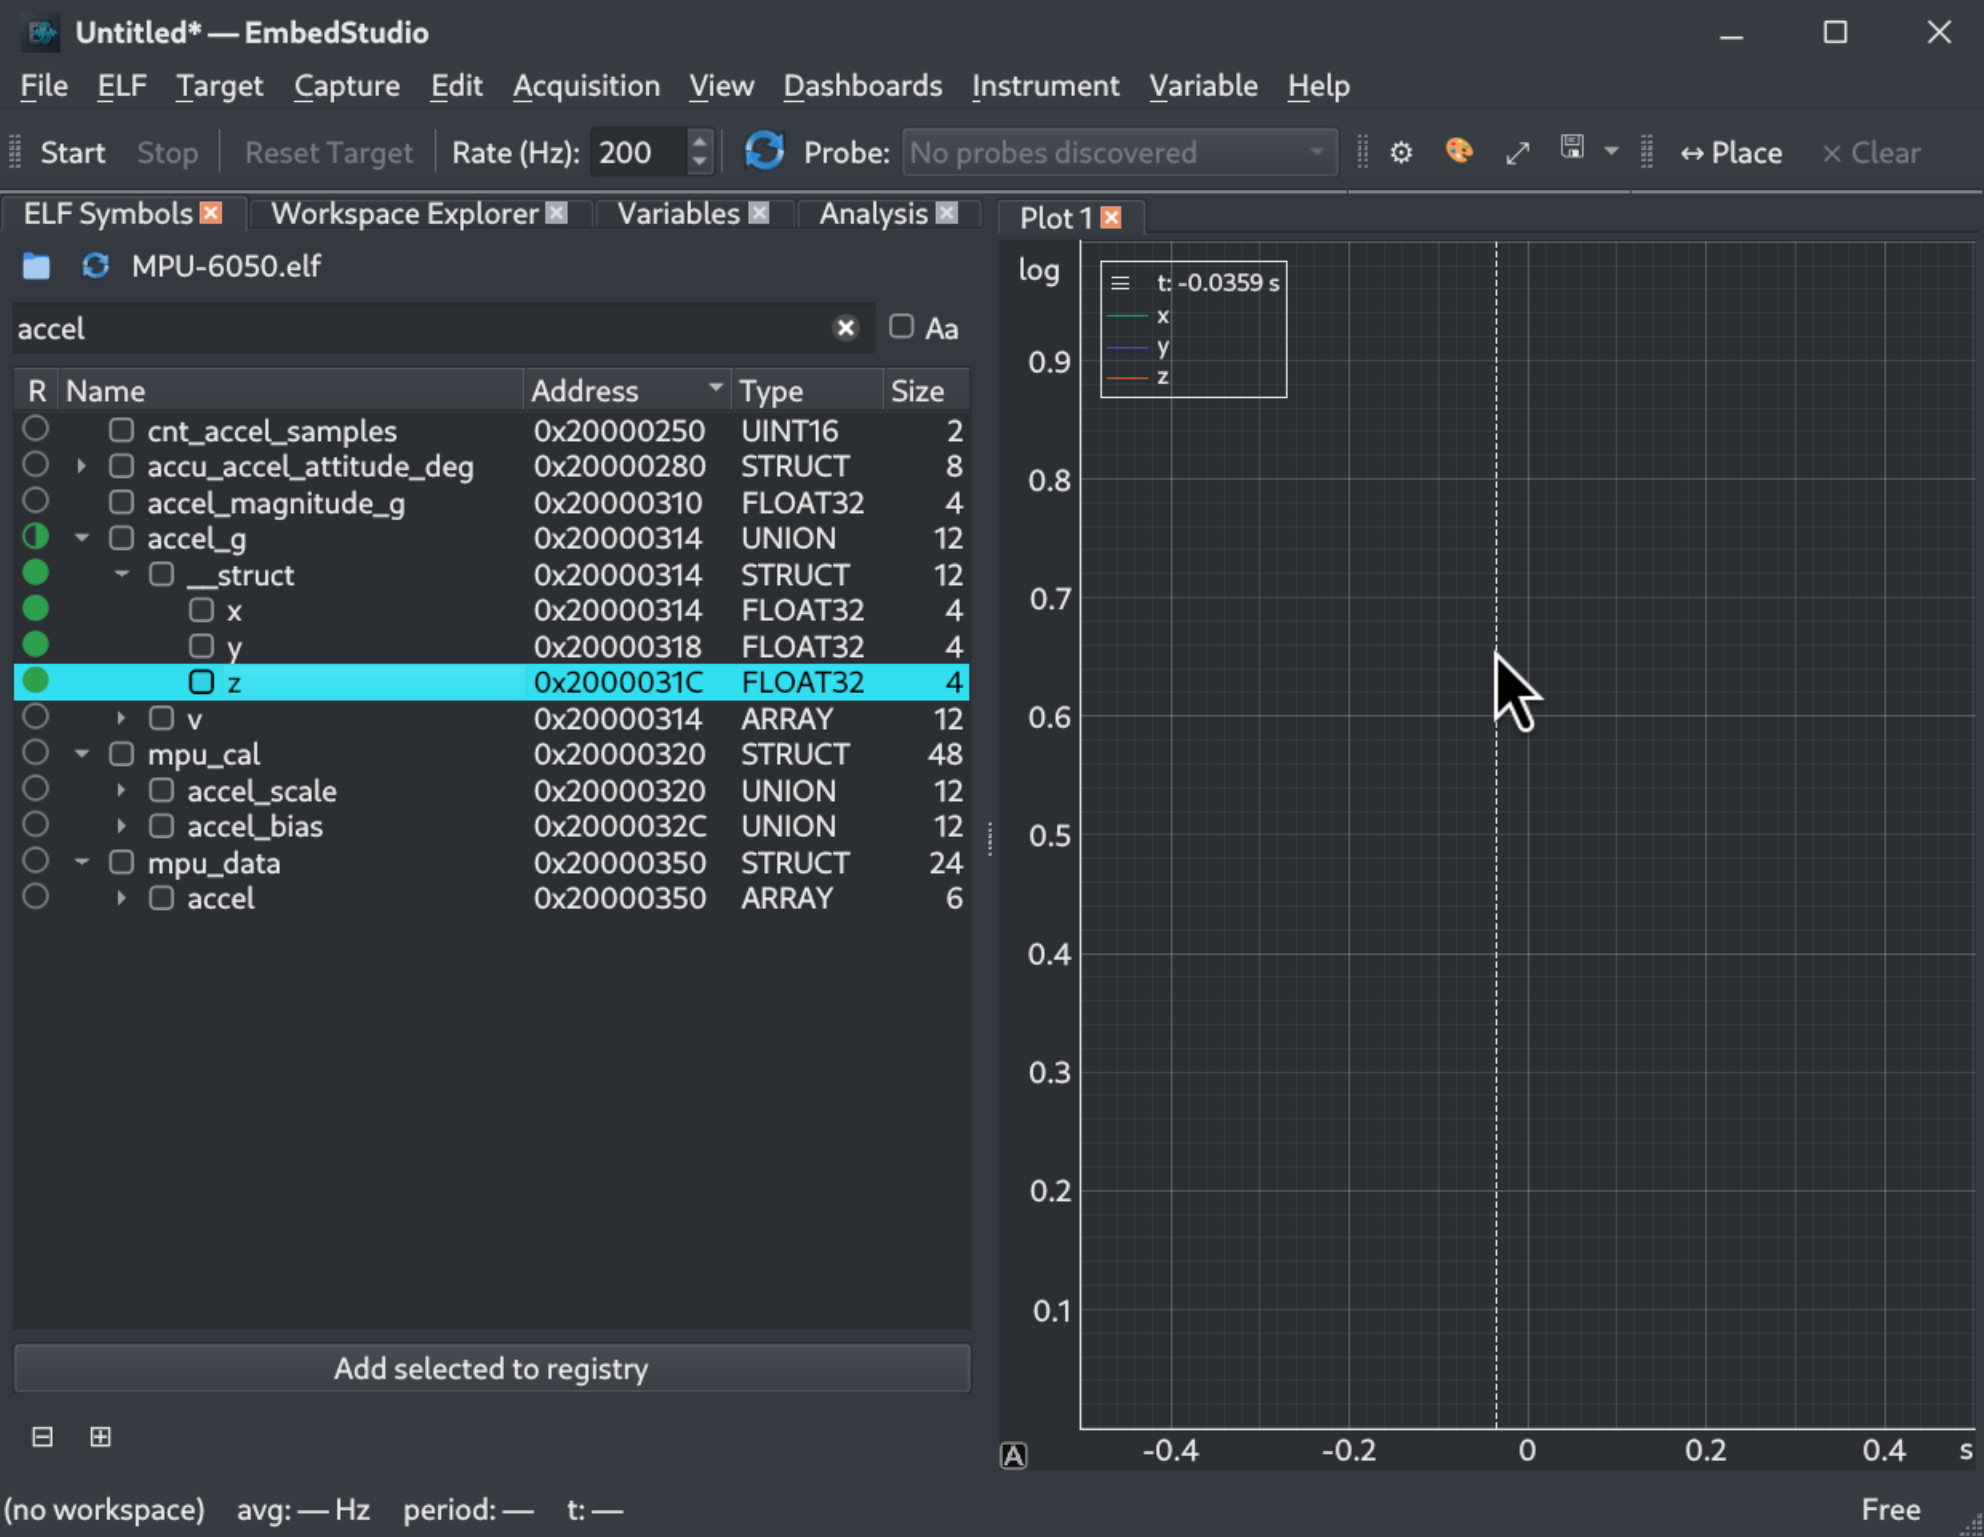
A new workspace already contains Dashboard 1 with an empty plot named Plot 1, so there is nothing to create first. Select the variables you want in the ELF Symbols panel, or a whole struct, and drag them onto the plot.
- The plot’s legend lists the variables you dropped.
- The R column of the symbol list marks a variable as imported into the workspace: a filled circle for a variable, a half-filled one for a struct only some of whose members are.
Only variables that are in the workspace are sampled while acquiring.
6.Choose the Sample Rate
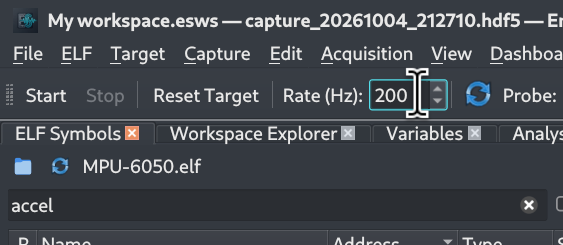
Set the rate in Hz in the toolbar before you start. It cannot be changed while acquiring.
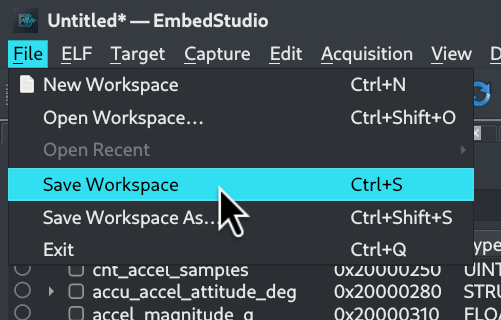
7.Save the Workspace
Choose File → Save Workspace (Ctrl+S) and give it a name. This is optional, but the workspace keeps your plots, so you can open the same layout again later with File → Open Workspace….
8.Select the Probe
EmbedStudio opens the link to the target when you press Start, so all that is left now is to say which probe to use.
If your probe does not appear, check that its drivers are installed, that no other debugging tool is holding it, and press Refresh Probes again.
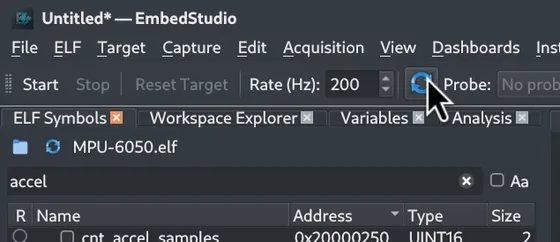
8.1Refresh the probe list
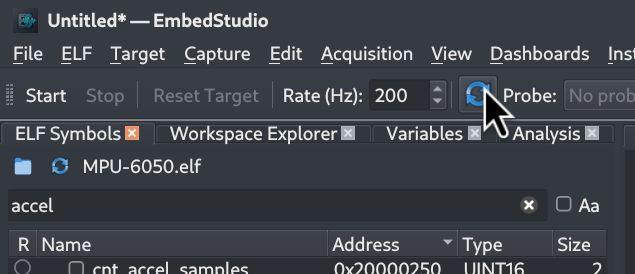
With the probe plugged in, press Refresh Probes next to the Probe list (Acquisition → Refresh Probes does the same).
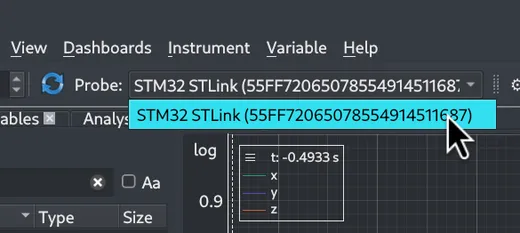
8.2Choose the probe
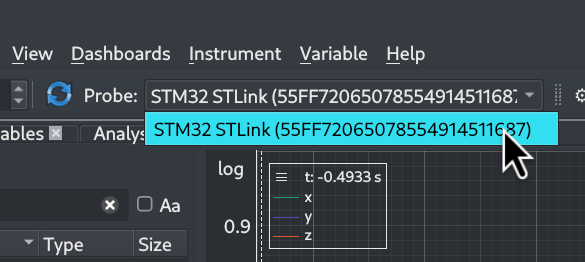
Open the Probe list and pick your probe. It is listed by name and serial number.
9.Start Acquisition
With the firmware you built flashed to the target and running, start acquiring. The plot follows the newest samples as they arrive, with no logging code added to the firmware.
Every acquisition is recorded to a capture file automatically, named after the date and time it started. Capture → Show Capture in Folder opens the folder it was written to.
9.1Press Start
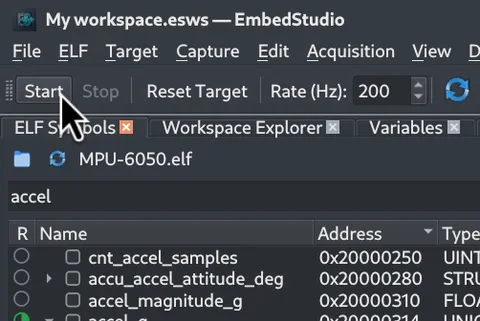
Press Start in the toolbar.
9.2Or use the menu
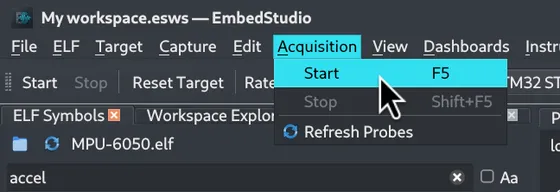
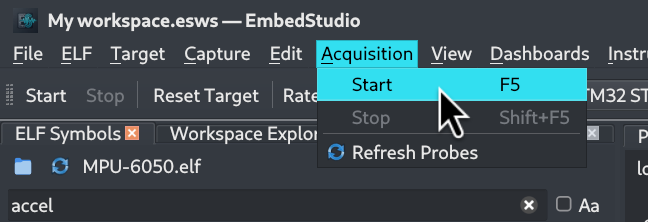
Acquisition → Start does the same, and so does F5.
10.Stop Acquisition
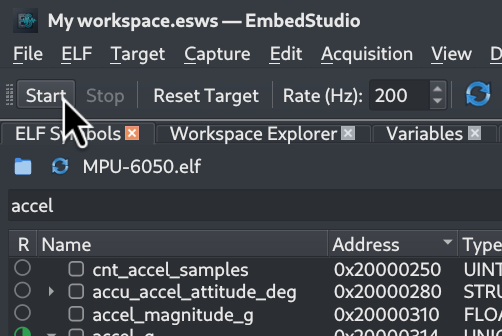
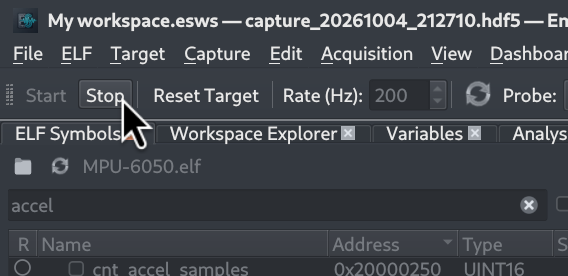
Press Stop, or choose Acquisition → Stop (Shift+F5). While acquiring, Start and the rate are greyed out; the title bar names the capture being written.
11.Observe the Collected Data
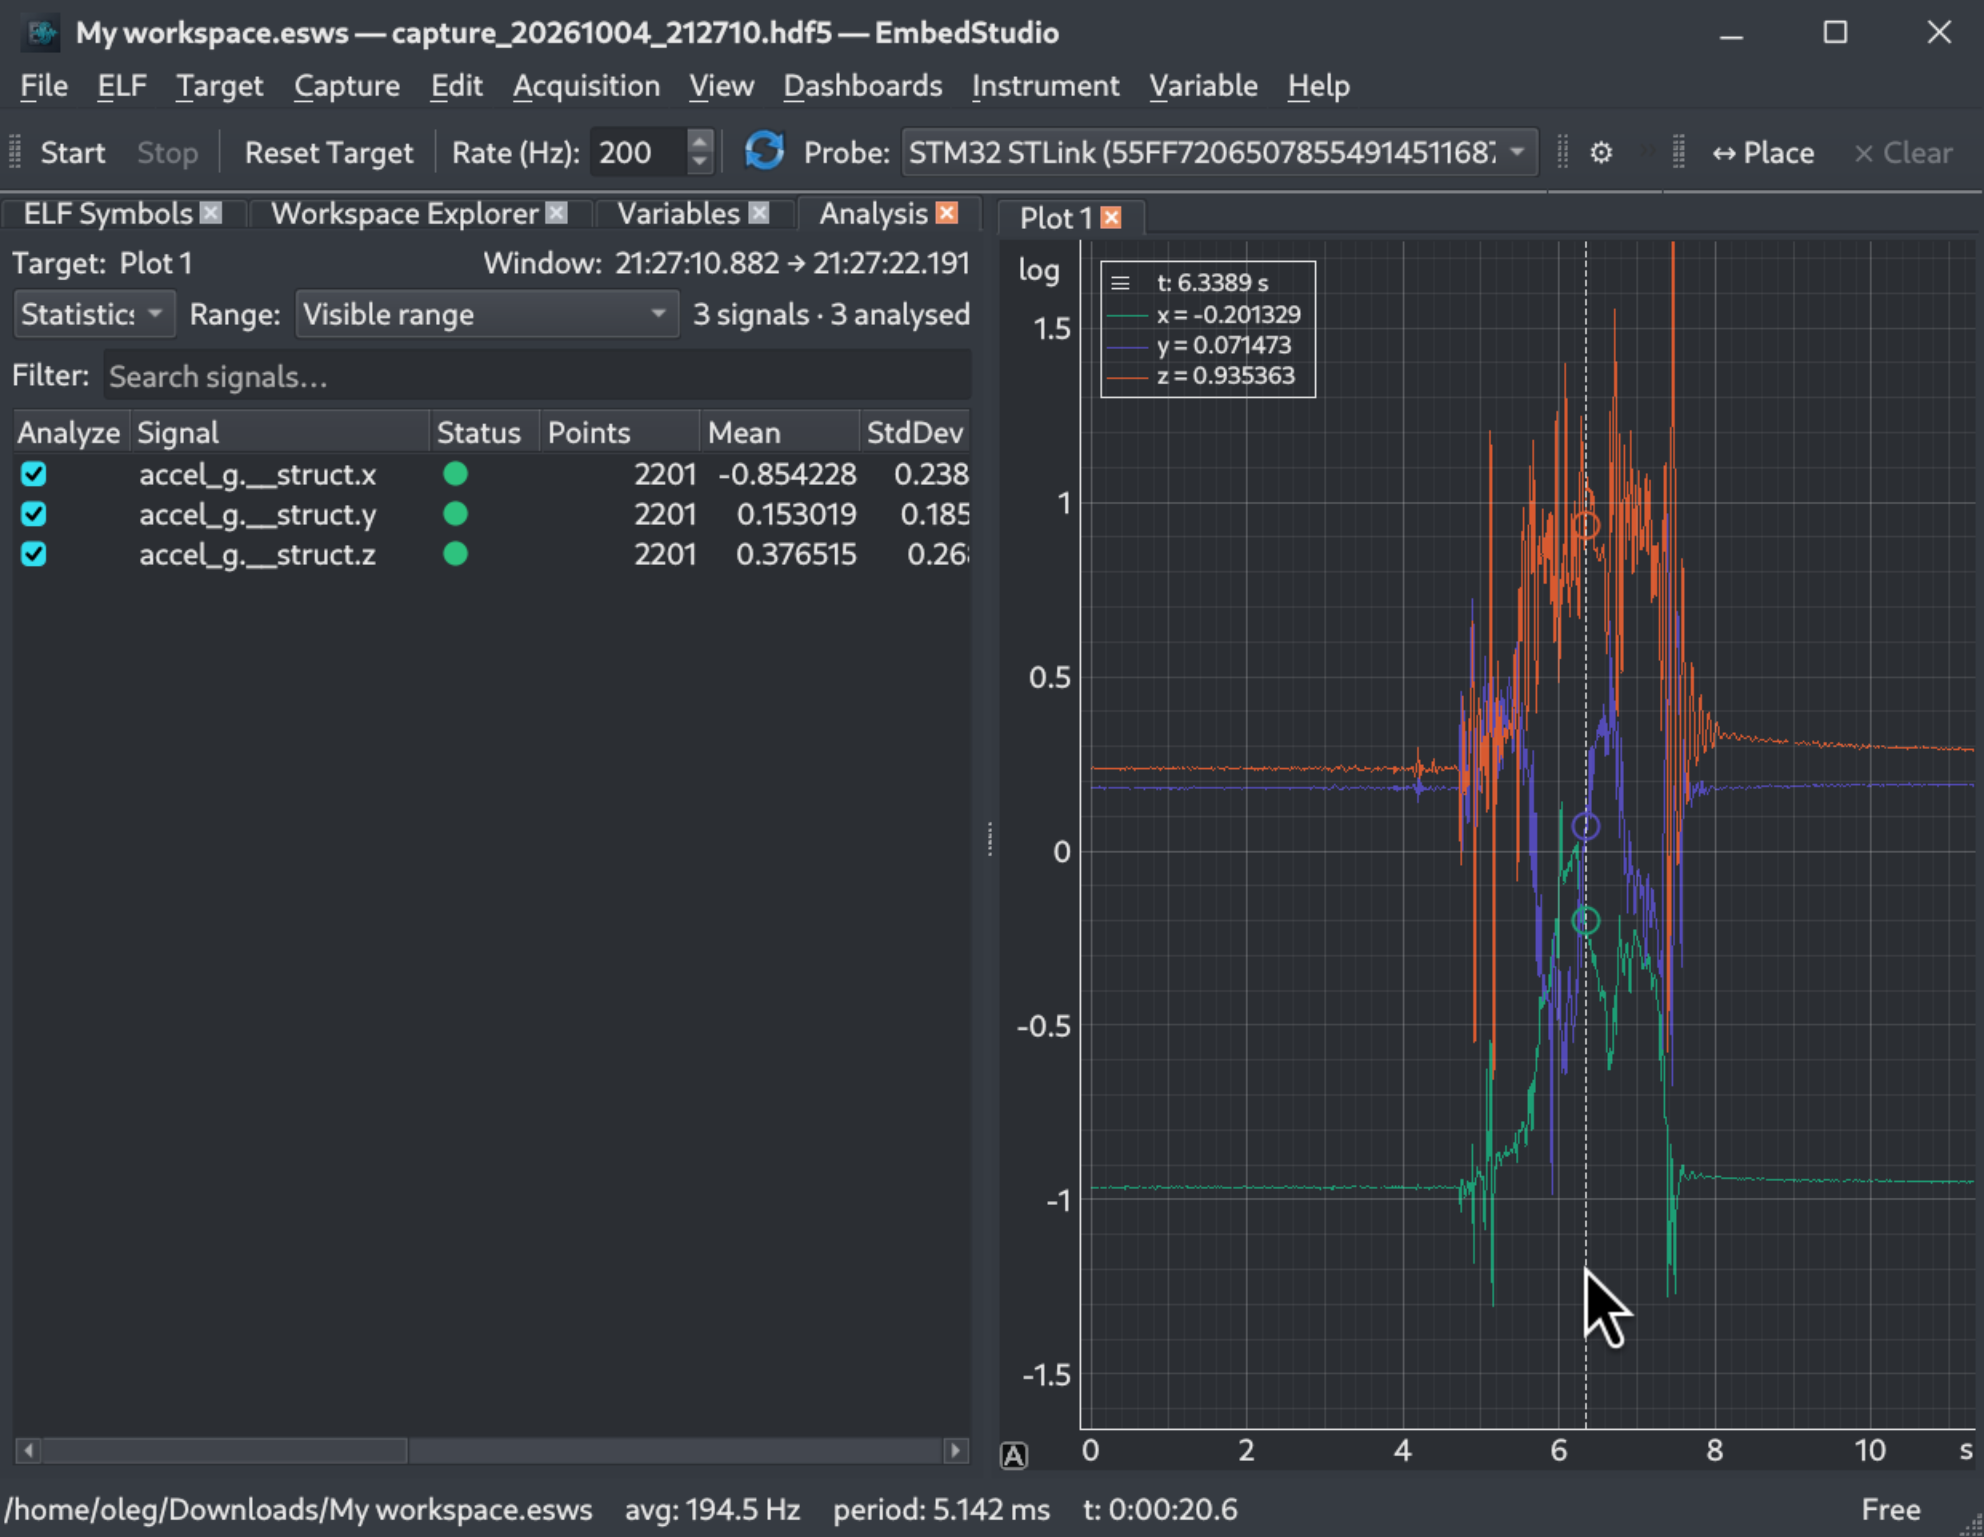
The recording stays on the plot. Move the mouse over it and the legend reads out every variable’s value at the cursor. The Analysis panel lists each signal with its number of points, mean and standard deviation over the visible range.
The capture can be opened again at any time with Capture → Open Capture(s)…, as in the first guide.
You’re Ready to Explore Further
You now have a working EmbedStudio setup and your first live visualization.
Common Problems
No Variables Found
- The ELF you loaded is the one your build produced.
- Debug information is present — the app reports an ELF without it and asks you to rebuild with -g.
- The ELF has not been stripped.
- ELF → ELF Information shows the optimization level and how many variables were constant-folded.
Cannot Connect to Target
- The probe’s drivers are installed (on Linux, the USB access rules for the probe).
- The probe is plugged in and listed in the toolbar — press Refresh Probes.
- The probe is not busy: a probe serves one client at a time, so close other debugging tools.
- The target is powered and wired to the probe’s SWD pins.
Variables Not Updating
- The variable has been added to the workspace and to an instrument.
- Acquisition has been started with Start.
- The firmware is running on the target.
- The flashed firmware is the build the ELF came from — ELF information and Target → Compare Flash with ELF… can confirm it.
- The license is installed: without one EmbedStudio runs as the Viewer and cannot acquire.
Ready to Build Your Own Dashboards?
Download EmbedStudio and start exploring your firmware variables.