
Can EmbedStudio Be Used with Production Firmware?
Optimized production firmware can be observed. Optimization and debug information are separate, ELF symbols work without DWARF, and DWARF adds richer type information.
Published
One question comes up quite often when discussing EmbedStudio:
Can it be used with production firmware, or does the firmware have to be built as a debug build?
The short answer is yes, EmbedStudio can be used with fully optimized firmware.
The key is to separate two things that are often treated as one: optimization and debug information.
Optimization and debug information are different things
Compiler optimization determines how the firmware is transformed to make it smaller, faster, or more efficient.
Typical optimization levels include:
-
-O0— no optimization -
-Og— optimization intended to remain relatively debugger-friendly -
-O1,-O2,-O3— increasing levels of optimization -
-Os— optimization for size
Debug information is controlled separately, typically with the -g option.
There is nothing unusual about building firmware with both:
-O2 -gor:
-Os -gThe resulting firmware can be fully optimized while the ELF file still contains the information needed to understand its symbols and types.
The debug information does not add tracing code to the firmware. It is metadata stored in the ELF file.
The binary or HEX file programmed into the microcontroller does not need to contain this information.
This means a practical workflow can be:
Source code
    ↓
-O2 / -Os + -g
    ↓
Firmware image  → programmed into the MCU
ELF             → kept on the development PC
The MCU runs optimized production code, while EmbedStudio uses the ELF as a description of that code.
What should be observable?
Optimization is not the only consideration.
EmbedStudio is intended primarily for observing application state over time: values that help explain how the system behaves during real operation.
Consider a motor controller. Variables such as these are often useful to observe:
static float motor_speed;
static float motor_current;
static float speed_target;
static ControllerState controller_state;
static uint32_t fault_flags;
These values describe the persistent state of the system.
A short-lived calculation inside a function is different:
void control_loop(void)
{
    float error = target - feedback;
    float correction = kp * error;

    pwm_set(correction);
}
If error or correction becomes important enough to observe continuously, it can be deliberately made part of the observable state:
static float error;
static float correction;
This is an important distinction.
If a value is important enough to observe over time, make it part of the observable state of the application.
This also makes the code easier to instrument and reason about independently of any particular debugging tool.
What happens to local variables under optimization?
This is where the difference between debugging and runtime observation becomes particularly important.
With optimization enabled, the compiler is free to:
-
keep values in registers,
-
eliminate calculations whose results are not needed,
-
combine or split variables,
-
move calculations,
-
inline functions,
-
reuse storage,
-
eliminate local variables entirely.
For example, the compiler may never create a persistent memory location corresponding to:
float correction;It may simply calculate the value in a register and immediately use it.
That is perfectly valid optimized code.
A debugger can sometimes reconstruct or display such values, depending on the optimization level and available debug information. But they are not necessarily persistent objects that can be acquired repeatedly over time.
For EmbedStudio, this is usually not a problem because the interesting targets are normally the values that represent the system’s state.
Making a variable explicitly observable
When a variable must remain an observable part of the application state, there are several ways to make that intention explicit.
For example:
static volatile float motor_speed;volatile tells the compiler that accesses to the object have observable significance and must not simply be optimized away as irrelevant accesses.
Other approaches can also be appropriate in specific projects, such as dedicated sections, used attributes, or linker KEEP() directives.
The right mechanism depends on the toolchain and linker configuration, but the underlying idea is the same:
make deliberately observable state explicit rather than relying on temporary implementation details.
What does the ELF give EmbedStudio?
EmbedStudio can obtain useful information from an ELF file even when it does not contain DWARF debug information.
The ELF symbol table can provide the name, address, and size of a symbol. For example:
motor_speed       0x20001234    4
motor_current     0x20001238    4
fault_flags       0x2000123C    4
This already provides a useful description of the memory occupied by each symbol.
However, the symbol table does not tell us what the object represents at the language level.
For example, a 12-byte symbol could be:
float values[3];or:
struct {
    float x;
    float y;
    float z;
} position;
It could also be another object occupying the same amount of memory.
The symbol table gives us the size, but not the semantic type of the object.
DWARF adds the type information
When the firmware is compiled with debug information, the ELF also contains DWARF data describing the program in much greater detail.
For example, EmbedStudio can obtain information equivalent to:
Name:    motor_speed
Address: 0x20001234
Size:    4 bytes
Type:    float
For more complex objects, DWARF can also describe:
-
structures and their members
-
arrays and their element types
-
enumerations
-
integer and floating-point types
-
pointers
-
relationships between types and variables
This means an ELF containing DWARF allows EmbedStudio to determine how a symbol should be interpreted automatically.
Without DWARF, the symbol name, address, and size can still be imported, but the user needs to specify the type information explicitly.
So the difference is primarily type information and convenience, rather than whether the ELF can be used at all.
There is also a practical trade-off: DWARF makes the ELF file considerably larger, but saves the developer from manually describing the types of variables they want to observe.
Coming in EmbedStudio 1.1.0
EmbedStudio 1.1.0 will make this workflow more convenient.
When an ELF contains symbol names, addresses, and sizes but no DWARF type information, variable types can be specified directly in EmbedStudio.
This makes it practical to work with smaller ELF files without giving up the ability to select and acquire variables.
Can EmbedStudio work without debug information?
Yes.
A production build may omit DWARF information entirely and still produce an ELF containing its symbol table.
EmbedStudio can use available symbols as an initial reference:
motor_speed    0x20001234    4
motor_current  0x20001238    4
fault_flags    0x2000123C    4
The required types can then be specified explicitly:
motor_speed    float
motor_current  float
fault_flags    uint32_t
For more complex objects, the user can likewise specify the appropriate interpretation of the symbol based on its known layout.
This requires more manual work, but there is no fundamental requirement for DWARF in order to acquire variables.
DWARF simply eliminates that extra work and provides considerably richer type information.
A practical production example
Imagine a motor controller that occasionally reports an unexpected fault in the field.
The firmware is running with full production optimization:
-O2 -gThe developer acquires:
speed_target
motor_speed
motor_current
controller_state
fault_flags
over a period of time.
The resulting trace might show:
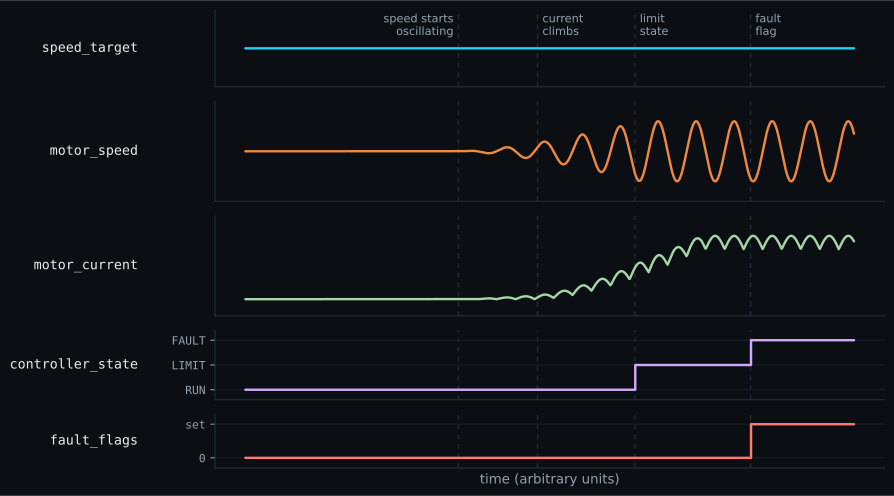 Figure 1 — A schematic of the trace described above, not a measurement. The target stays flat, the speed starts oscillating, the current climbs, the controller enters the limiting state, and only then does the fault flag appear.
Instead of stopping the system at a particular instruction and inspecting its current state, the developer can see the sequence of events that led to the fault.
Perhaps the target remained constant, the speed started oscillating, current increased, the controller entered a limiting state, and only then did the fault flag appear.
That kind of information is often much more useful for diagnosing a problem that only occurs under particular real-world conditions.
Choosing what to observe
There is no need to make every variable observable.
A useful rule is to ask:
Does this value help explain the behavior of the system over time?
If the answer is yes, it is a good candidate for persistent application state and acquisition.
Typical candidates include:
-
sensor values
-
setpoints
-
controller outputs
-
measured currents and speeds
-
state-machine states
-
counters
-
flags
-
diagnostic values
-
limits and thresholds
-
important intermediate results
Different tools are useful for different questions:
| Tool | Best suited for | Typical question |
|---|---|---|
| Debugger | Inspecting implementation details at a particular execution point | Why is this variable, loop, or function behaving this way right now? |
| Unit tests | Verifying function or module behavior across defined inputs | Does this function produce the correct result for these inputs? |
| EmbedStudio | Observing application state and behavior over time while the system keeps running | What was the system actually doing before, during, and after the problem? |
There is also a practical limitation to traditional breakpoint-based debugging: some systems cannot simply be stopped without changing the behavior being investigated.
A motor speed regulator is a good example. Its control loop may need to run continuously at a fixed rate. Stopping the CPU to inspect a variable can change the very behavior you are trying to understand.
The same applies to systems interacting with the physical world, communication protocols, timing-sensitive control loops, and other real-time applications.
In these situations, observing variables continuously while the system keeps running can provide information that a conventional breakpoint-based debugger cannot.
Short-lived implementation details are still often better left to the debugger, while unit tests are better suited to verifying function behavior across a defined set of inputs.
The practical workflow
A production-oriented workflow can therefore remain very simple:
-
Build the firmware with the desired production optimization level.
-
Keep the ELF produced by that build.
-
Retain DWARF information if convenient.
-
Program the normal optimized firmware image into the target.
-
Use EmbedStudio to acquire the application state that matters.
There is no need to turn off optimization simply because you want to observe the firmware.
The more important decision is what state the application should expose for observation.
Conclusion
EmbedStudio does not require a special unoptimized version of the firmware.
Production optimization and debug information are separate concerns. An optimized firmware can be accompanied by an ELF containing DWARF information, giving EmbedStudio rich type information without changing what runs on the MCU.
Even without DWARF, the ELF symbol table can provide names, addresses, and sizes. The missing piece is the semantic type information needed to interpret those bytes as scalars, arrays, structures, or other objects.
And for the variables that matter most during runtime analysis, the best approach is often to make them explicit parts of the application’s observable state.
Optimize the firmware as you normally would. Keep the information needed to understand it. And deliberately expose the state that is worth observing over time.