
Real-Time Variable Monitoring
Observe firmware variables directly from memory.
Observe variables directly from your target MCU through the debug interface. Build dashboards, plots and analysis tools without adding telemetry code or modifying your firmware.
Want every feature? Try Professional free for 14 days. Start your free trial
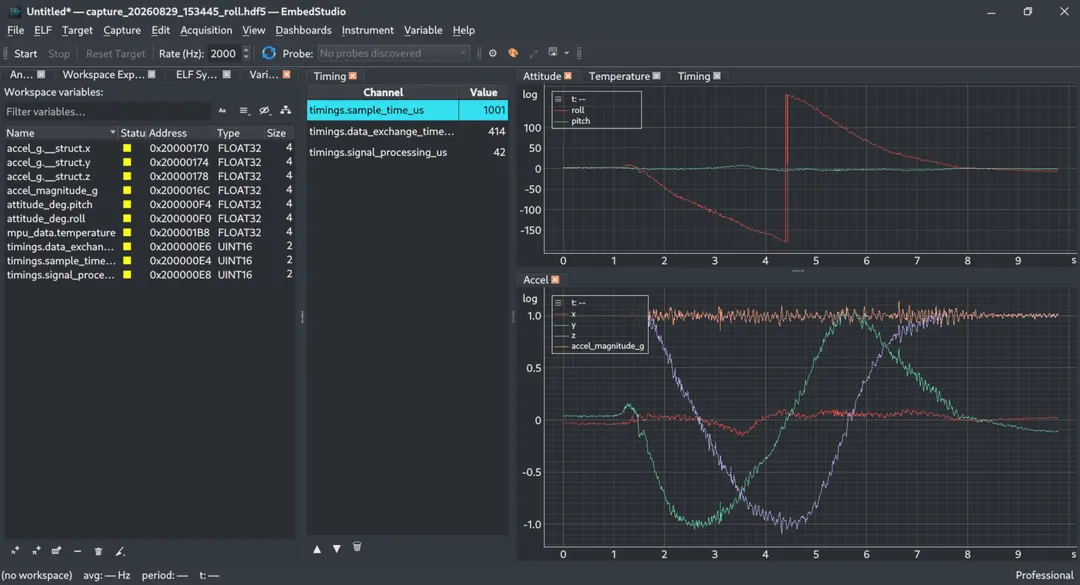
Most teams still see inside running firmware through UART logging, temporary debug code, custom telemetry protocols and one-off visualization scripts. Each one costs a rebuild, changes timing, and gets thrown away.
EmbedStudio reads firmware variables directly through the debug interface, so the firmware you already have is the firmware you observe.
Attach a supported debug probe to the SWD header of your target. See Supported Hardware for what has been tested.
Variable names, addresses and types are discovered automatically from the DWARF debug information in your build.
Choose which variables to acquire, monitor and control.
Visualize data with dashboards, plots, tables and analysis tools.
Observe firmware variables directly from memory.
Build project-specific workspaces and instrumentation.
Track signals using synchronized plots.
Inspect values in real time.
Create derived variables and custom calculations.
Inspect signal frequency content without exporting data.
Use every Professional instrument and analysis, with no limits, on your own firmware, and decide whether it fits your workflow.
You need a free account with a confirmed email address.
EmbedStudio is a lightweight debugging and visualization platform for embedded firmware developers. It traces runtime variables from your microcontroller and turns live embedded data into real-time plots and dashboards, so you can understand system behavior without changing it.
EmbedStudio reads symbol information from your firmware ELF file using DWARF debug data, then observes the corresponding variables directly from device memory over an SWD debug connection. This low-intrusion approach requires no printf logging or added instrumentation, so firmware timing and behavior stay intact.
EmbedStudio targets ARM Cortex-M microcontrollers, including the STM32 family. Any MCU reachable over SWD with standard ELF/DWARF debug symbols fits the workflow.
No. EmbedStudio observes existing variables through the debug interface instead of injecting logging code. You do not need to modify your firmware or add intrusive instrumentation to trace runtime values.
EmbedStudio uses SWD (Serial Wire Debug) to read live memory and variables from ARM Cortex-M targets, the same interface used by common in-circuit debuggers on STM32 hardware.
Yes. Every account with a confirmed email address can claim one 14-day Professional trial from its account page. It covers every Professional feature on one computer, and the 14 days start when you activate it, not when you claim it. Nothing is charged and nothing renews: afterwards EmbedStudio continues as the Free edition and your recordings stay readable.
Download the Free Edition and start visualizing firmware variables in minutes.