
When Accelerometer Roll Estimation Fails: The Pitch Singularity
As pitch approaches 90 degrees the accelerometer roll estimate becomes unstable while the sensor barely moves. Why the information disappears, what a regularization coefficient buys, what it costs, and the measured tradeoff across five values of the coefficient.
Published
In the previous experiment, we demonstrated how the MPU6050 accelerometer can be used to estimate sensor attitude from the direction of the gravity vector. The obtained results were surprisingly good and showed that a low-cost MEMS accelerometer can provide accurate inclination measurements without long-term drift.
The mathematical framework used in these experiments follows the approach described in NXP Application Note AN3461, Tilt Sensing Using a Three-Axis Accelerometer.
While exploring the full range of sensor orientations, however, an interesting problem became apparent. Under certain conditions, the calculated roll angle becomes unstable despite the sensor remaining almost perfectly stationary.
In this experiment, we investigate this failure mode, explain its cause, and evaluate a practical modification that can improve the stability of the roll estimate.
When Roll Estimation Fails
The roll angle derived from the accelerometer is calculated as:
roll = atan2f(ay, az);where:
axis the acceleration measured along the X axis,ayis the acceleration measured along the Y axis,azis the acceleration measured along the Z axis.
To investigate the behavior of this equation, the sensor was slowly rotated around its pitch axis while recording accelerometer measurements and calculated attitude.
The acquisition configuration was unchanged from the previous experiments:
- Sampling rate: 1 kHz
- Digital low-pass filter: approximately 22 Hz
EmbedStudio read the firmware’s own variables over SWD for thirty-five seconds, at about 280 samples per second.
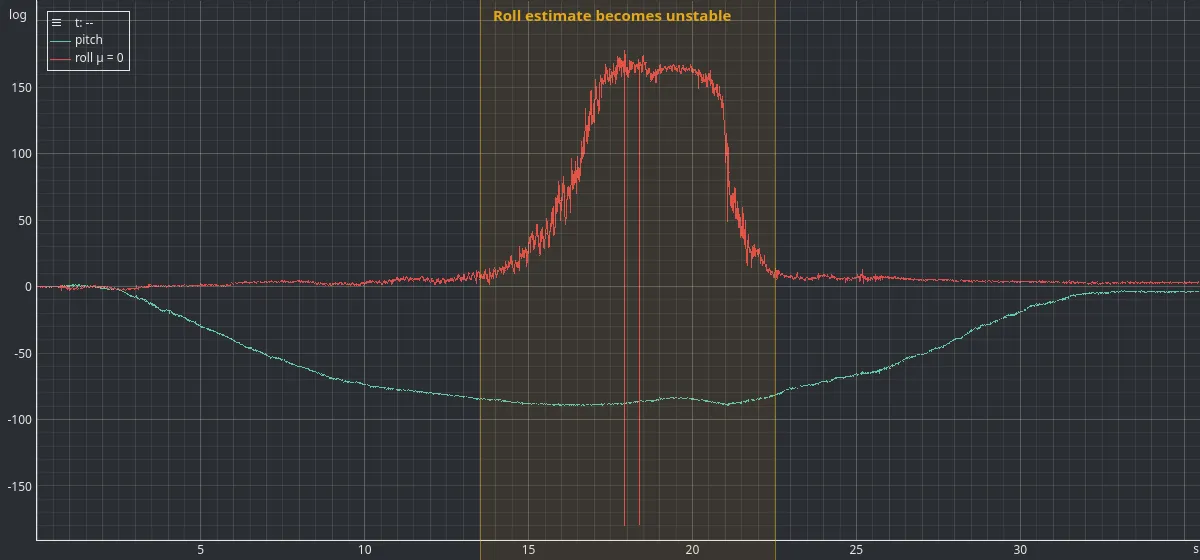 Figure 1 — One slow sweep about the pitch axis. Pitch (green) moves smoothly to −89.4° and back; roll (red) is quiet until pitch passes about −84°, then swings across the whole ±180° range. The vertical lines near 18 s are the ±180° wrap of experiment #006, reached here by noise rather than by movement.
For most of the rotation range, the roll estimate behaves as expected. However, as the pitch angle approaches ±90°, the roll signal becomes increasingly unstable.
The surprising part is that the sensor itself is not undergoing significant roll motion. Nevertheless, the calculated roll angle starts exhibiting large fluctuations.
At first sight, this behavior may appear to be a sensor accuracy problem. In reality, the cause is much more fundamental.
Why Does It Happen?
Consider what happens when the sensor approaches a pitch angle of −90°.
The gravity vector becomes almost aligned with the sensor X axis:
ax ≈ 1 g
ay ≈ 0 g
az ≈ 0 g
The roll calculation therefore approaches:
roll = atan2f(0, 0);In practice, accelerometer measurements are never exactly zero. Even a stationary sensor contains measurement noise.
Instead of:
ay = 0
az = 0
the sweep above measured, averaged over a second near the worst orientation:
ay = 0.019 g
az = 0.018 g
These errors are tiny compared to the 1 g gravity signal, but they are now comparable to the quantities used to calculate roll.
Consequently, very small variations in the measured acceleration can produce surprisingly large changes in the estimated angle.
This effect is not specific to the MPU6050. It is a consequence of the geometry of the measurement itself.
As discussed in AN3461, accelerometer-based attitude estimation relies entirely on the direction of the gravity vector. The roll equation uses the projection of this vector onto the YZ plane. As the gravity vector approaches the X axis, this projection becomes increasingly small, making its direction highly sensitive to measurement errors.
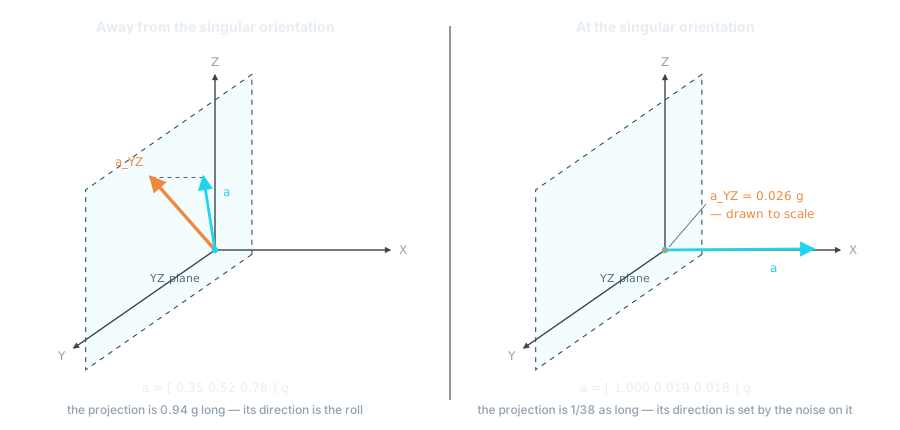 Figure 2 — Roll is the direction of the acceleration vector’s projection onto the YZ plane. Away from the singular orientation that projection is nearly a full g long. At the orientation measured in figure 1 it is 0.026 g — the dot at the origin, drawn to the same scale — and its components carry about 0.008 g of noise.
At exactly ±90° pitch, the projection disappears completely.
The accelerometer therefore contains no information that can be used to determine roll in this configuration.
Can We Improve the Situation?
Although the missing information cannot be recovered, we can modify the calculation to reduce its sensitivity to noise.
The idea is simple: prevent the second argument of atan2f() from becoming
arbitrarily small.
A modified roll calculation can be written as:
where is a regularization coefficient.
When the equation reduces to the original roll calculation.
As the sensor approaches ±90° pitch, approaches ±1 g while approaches zero. The additional term therefore prevents the denominator from collapsing completely.
There is one detail the written form hides. A square root is never negative, so a denominator built out of one would confine the result to −90°…+90° and the estimator could never report a board tipped past vertical. The sign of has to be carried explicitly, which is why the firmware spells it:
void ahrs_estimate_regularized_attitude(const vector_3f_t* const acceleration,
        ahrs_attitude_t* const attitude, const float mu)
{
    attitude->roll = atan2(acceleration->y,
            copysignf(1.0f, acceleration->z) *
            sqrtf(mu * acceleration->x * acceleration->x +
                  acceleration->z * acceleration->z));
    attitude->pitch = atan2(-acceleration->x,
            sqrtf(acceleration->y * acceleration->y +
                  acceleration->z * acceleration->z));
}
The pitch calculation is untouched. Its own square root is a length, and pitch is correctly restricted to −90°…+90° by it.
The price is that we deliberately modify the ideal attitude equation.
This introduces an engineering tradeoff:
smaller μ
    better accuracy
    weaker stabilization

larger μ
    stronger stabilization
    larger estimation error
Before performing measurements, we can estimate this error analytically.
Analytical Error Estimation
Assuming the accelerometer measures only gravity, the normalized acceleration components for roll and pitch are:
Substituting these values into the regularized roll equation gives:
which can be rewritten as:
The resulting estimation error is:
This equation allows us to predict the maximum error introduced by a given value of .
Maximum Error Within Typical Operating Ranges
The table below shows the theoretical worst-case roll error for several symmetric operating ranges.
The percentage indicates the error relative to the maximum true roll angle within the specified range.
| Range | μ = 0.1 | μ = 0.01 | μ = 0.001 | μ = 0.0001 |
|---|---|---|---|---|
| ±30° | 0.536° · 1.79 % | 0.055° · 0.18 % | 0.0055° · 0.018 % | 0.00055° · 0.0018 % |
| ±45° | 2.608° · 5.80 % | 0.284° · 0.63 % | 0.0286° · 0.064 % | 0.00286° · 0.0064 % |
| ±60° | 10.575° · 17.63 % | 1.425° · 2.38 % | 0.148° · 0.247 % | 0.0149° · 0.025 % |
| ±85° | 69.595° · 81.88 % | 44.008° · 51.77 % | 15.467° · 18.20 % | 3.210° · 3.78 % |
Table 1 — Worst-case roll error introduced by the regularization term, over a symmetric range of roll and pitch. Theory only; no measurement is involved.
Several observations can immediately be made.
For applications limited to moderate angles, such as ±30° or ±45°, even relatively large values of introduce only a small error.
As the operating range expands towards the singular orientation, the cost of regularization increases dramatically.
This is an important indication that regularization improves numerical stability but does not solve the underlying observability problem.
Error Distribution
To better visualize the effect of regularization, figures 3 and 4 show the theoretical roll error as a function of both roll and pitch.
Both surfaces are drawn on the same vertical scale, because the whole point of the pair is that one is far taller than the other.
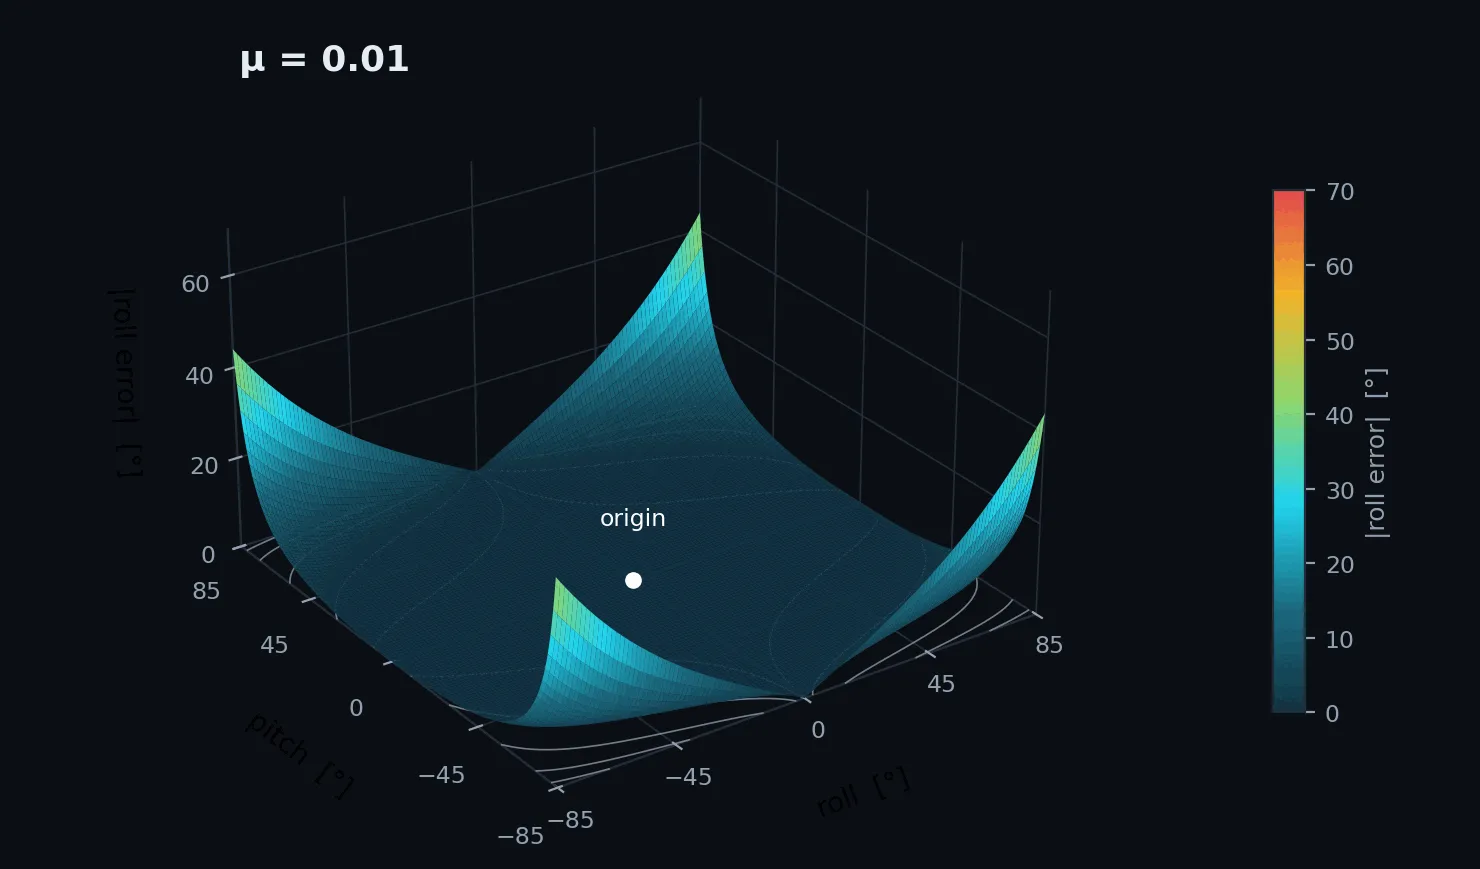 Figure 3 — Theoretical roll estimation error introduced by regularization coefficient μ = 0.01. The error is under a tenth of a degree over most of the useful range and reaches 44.0° in the corners, where both angles approach 85°.
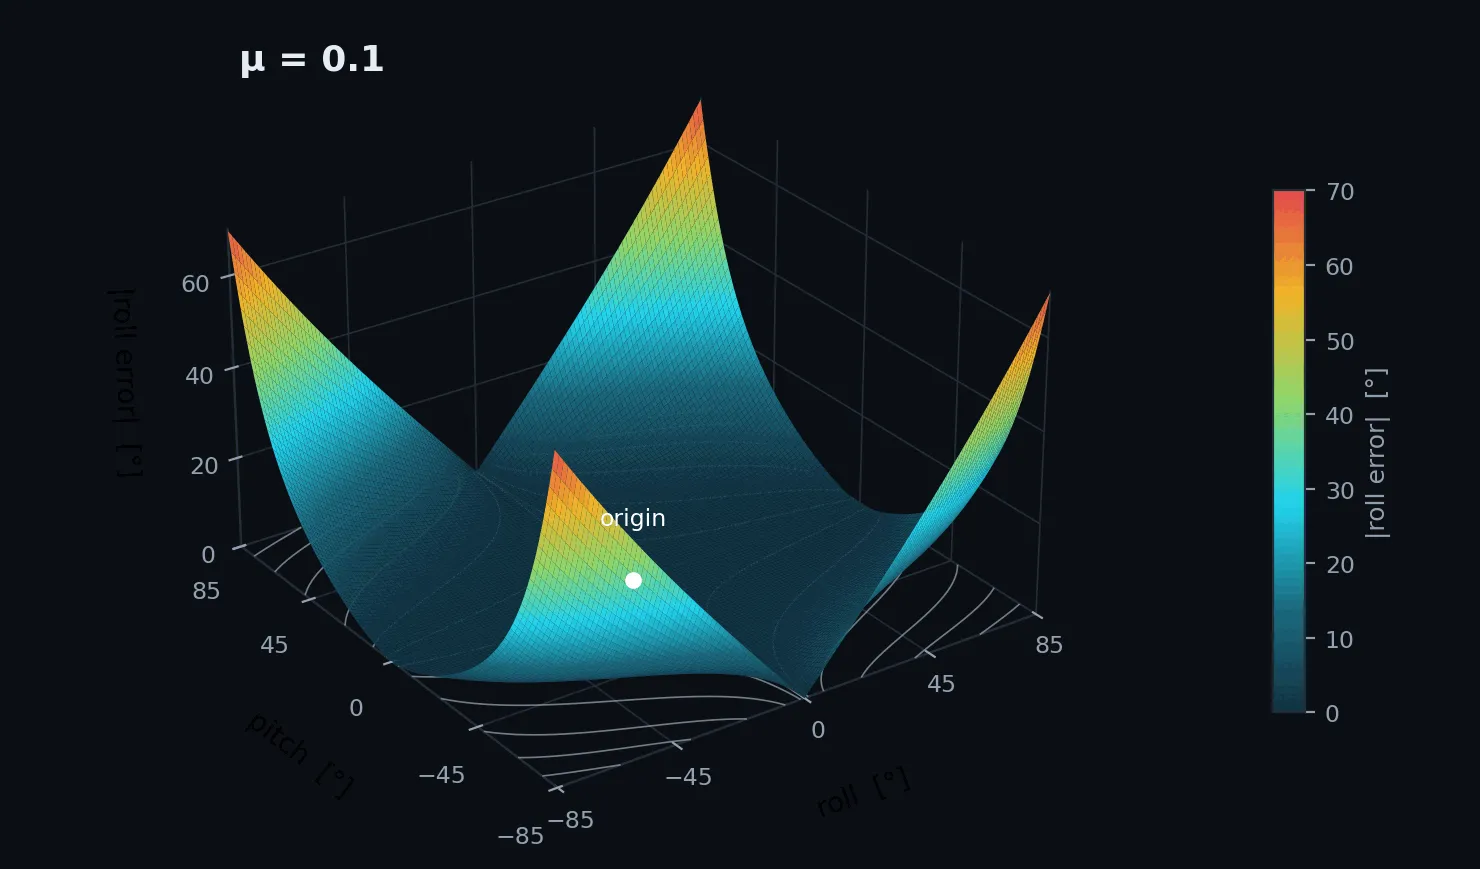 Figure 4 — The same, for μ = 0.1, on the same axes. Ten times the coefficient is roughly ten times the error while the error is small, but the corner peak only grows from 44.0° to 69.6° — the estimator is already saturated there.
The error is smallest near the origin, where the original roll equation is already well conditioned.
As the sensor approaches the problematic orientations, the error increases rapidly.
Larger values of produce substantially stronger distortion of the estimated attitude.
Experimental Verification
To verify the analytical predictions, several regularized estimators were evaluated simultaneously using the same accelerometer samples.
The following coefficients were tested:
enum {
    N_REG_VALS = 5,
};

float mu[N_REG_VALS] = {
    0.0f,
    0.1f,
    0.01f,
    0.001f,
    0.0001f,
};
The corresponding attitude estimates were stored in arrays:
ahrs_attitude_t attitude_reg[N_REG_VALS];
ahrs_attitude_t attitude_reg_deg[N_REG_VALS];
After each accelerometer update, all estimators were evaluated:
for (uint8_t i = 0; i < N_REG_VALS; ++i) {

    ahrs_estimate_regularized_attitude(
        &accel_g,
        &attitude_reg[i],
        mu[i]
    );

    attitude_reg_deg[i].roll =
        rad_to_deg(attitude_reg[i].roll);

    attitude_reg_deg[i].pitch =
        rad_to_deg(attitude_reg[i].pitch);
}
This guarantees that every estimator receives exactly the same accelerometer measurement. The only difference between the outputs is the value of .
Nothing had to be rebuilt to look at them. The five arrays are ordinary firmware variables, so EmbedStudio read all five roll estimates and the pitch out of the running target and plotted them together.
The sensor was then slowly rotated through the problematic region while all five roll estimates were recorded.
Experimental Results
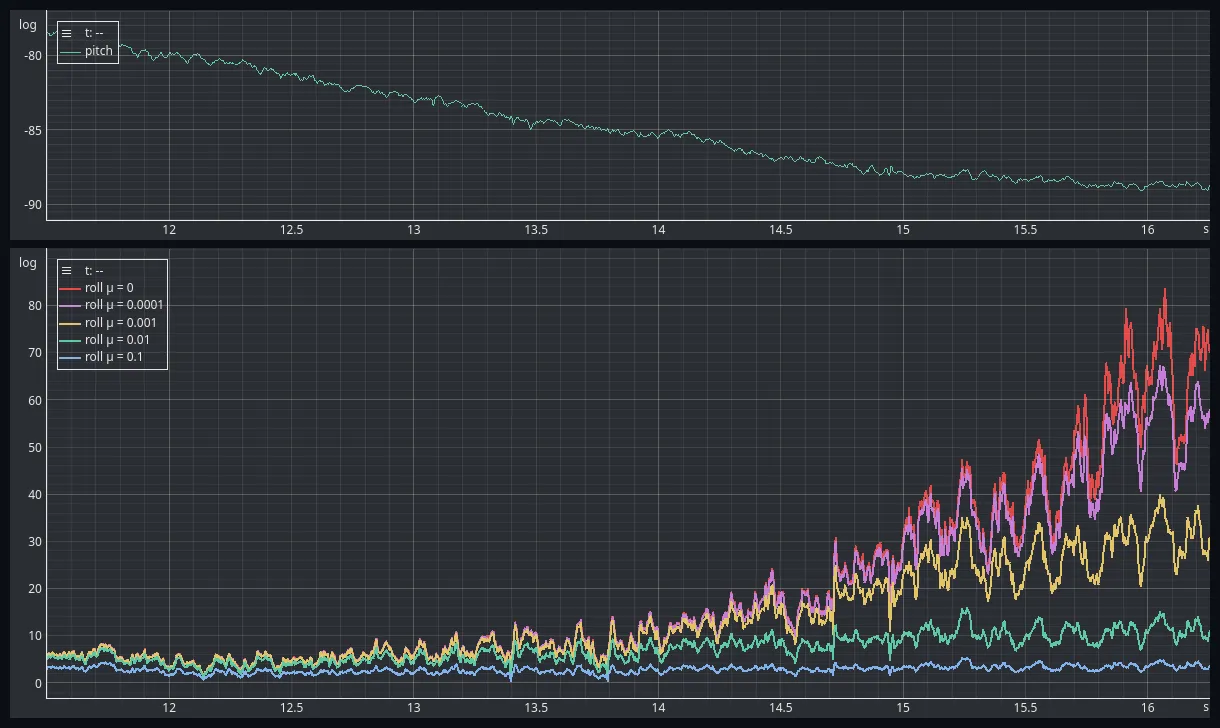 Figure 5 — The approach to the singular orientation, 11.5 s to 16.25 s of the same sweep. Pitch (top) goes from −78° to −89°. The five roll estimates start together and fan apart in order of μ. The window stops at 16.25 s, just before a_z changes sign; past that point every estimator correctly reports a board that has gone past vertical, which is a real change of orientation rather than the noise this figure is about.
The measurements confirm the analytical predictions.
The original estimator () becomes increasingly unstable as the pitch angle approaches the singular orientation.
Increasing progressively reduces the observed fluctuations.
At the same time, the estimates begin to deviate from the original attitude calculation.
The larger the value of , the earlier this deviation becomes visible.
To put numbers on it, the Analysis panel was pointed at the last 1.25 s of that window, where the board is nearly still — pitch moves by 1.38° over the whole stretch.
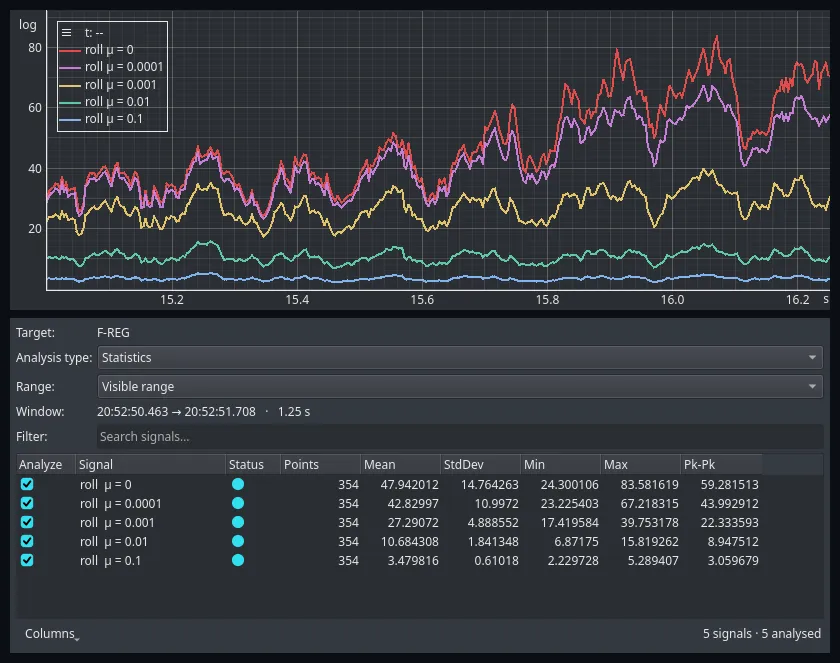 Figure 6 — The same five estimates over 1.25 s at a pitch of −88.4°, measured by the Analysis panel. Standard deviation runs from 14.76° at μ = 0 down to 0.61° at μ = 0.1; peak-to-peak from 59.3° to 3.1°.
| μ | Mean | Std. dev. | Peak-to-peak |
|---|---|---|---|
| 0 | 47.94° | 14.76° | 59.28° |
| 0.0001 | 42.83° | 11.00° | 43.99° |
| 0.001 | 27.29° | 4.89° | 22.33° |
| 0.01 | 10.68° | 1.84° | 8.95° |
| 0.1 | 3.48° | 0.61° | 3.06° |
Table 2 — The five estimates over the same 1.25 s, as EmbedStudio measured them. The board’s pitch moved by 1.38° over the whole window.
Two things are worth reading off that table.
The wobble falls by a factor of 24 between the unmodified estimator and the strongest one tested. The pitch, meanwhile, moved by less than a degree and a half. A 59° swing in roll came out of an orientation that barely changed.
And the means differ as much as the spreads do — 47.9° against 3.5°. All five numbers describe the same physical orientation. That is the clearest statement of the problem there is: when a quantity is not observable, five estimators can all be reasonable and all disagree.
What It Costs at Ordinary Angles
The other half of the tradeoff is easier to miss, because there is nothing to see. A second recording swept the board through arbitrary inclinations well away from the singular orientation, reaching ±45° of roll and −38° to +20° of pitch.
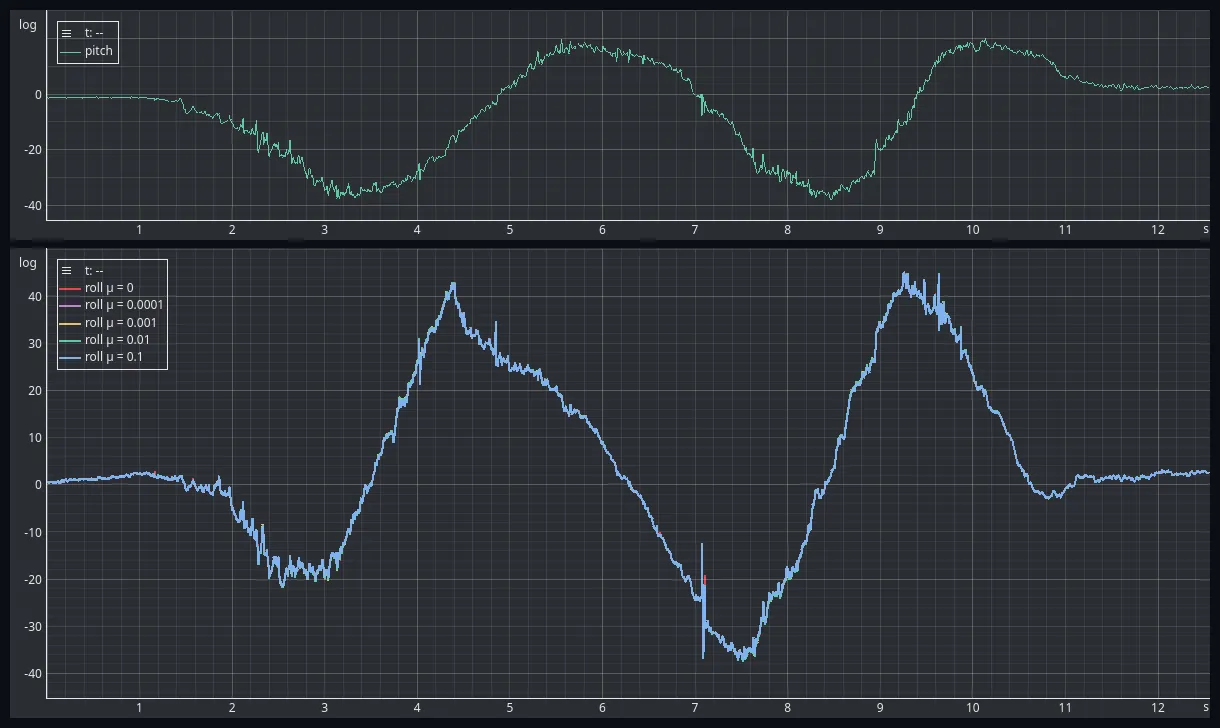 Figure 7 — All five estimates over an ordinary ±45° workout. Every curve is drawn; they coincide to within the line width. The legend is the only way to tell there are five of them.
The differences are there, and they follow the coefficient exactly:
| μ | Median difference from μ = 0 |
|---|---|
| 0.0001 | 0.0001° |
| 0.001 | 0.0008° |
| 0.01 | 0.0052° |
| 0.1 | 0.0298° |
Table 3 — Typical deviation from the unmodified roll estimate over the ±45° recording. A factor of ten per decade of μ, as Table 1’s worst cases predict.
The worst case matters less here than it looks. The largest single deviation over that recording is about 2.7°, and it is the same 2.7° for μ = 0.0001 as for μ = 0.01 — which is proof that it is not the coefficient. It is the acquisition: EmbedStudio reads each variable in its own SWD transaction, so during a fast movement two channels can come from firmware iterations a millisecond apart. That skew is larger than the effect being measured, so this recording confirms that the cost is small without being able to resolve how small. The median, where the skew averages out, is what carries the ladder.
What Did We Actually Fix?
It is tempting to view the regularized equation as a solution to the problem.
In reality, it is not.
The regularization improves the numerical behavior of the estimator, but it does not provide any additional information.
When gravity aligns with the sensor X axis, the accelerometer still cannot determine rotation around that axis.
The modified equation simply constrains the behavior of the estimator when the available information becomes insufficient.
In other words:
We have made the estimator more stable, but we have not made the accelerometer more informative.
This distinction is important when designing a complete attitude estimation system.
Conclusions
The classical accelerometer roll calculation becomes increasingly sensitive to noise as the gravity vector approaches the sensor X axis.
This occurs because the projection of gravity used for roll estimation becomes very small and eventually disappears completely. At −88.4° of pitch that projection measured 0.026 g against about 0.008 g of noise, and the calculated roll wandered over 59° while the board’s pitch moved by 1.4°.
A regularized roll equation can significantly improve stability by preventing the denominator of the calculation from approaching zero. Over that same window the spread fell by a factor of 24, from 14.76° to 0.61°.
The improvement comes at the cost of systematic error.
The coefficient therefore directly controls the tradeoff between stability and accuracy.
For moderate operating ranges, values around introduce negligible error while providing noticeable stabilization — a worst case of 0.029° within ±45°, and a measured typical deviation of 0.0008° over a real recording. Larger values produce stronger stabilization but increasingly distort the estimated attitude.
Most importantly, the experiment demonstrates that the limitation is fundamental. Regularization can improve the behavior of the estimator, but it cannot recover information that is absent from the accelerometer measurement.
This naturally leads to the next question:
Can another sensor provide the missing information?
The answer comes from the second sensing element inside the MPU6050: the gyroscope.
Experiment data
The raw datasets used in this experiment are publicly available in the EmbedStudio Experiments repository.
The dataset contains:
- the sweep through the singular orientation, in which pitch reaches −89.4° and the unregularized roll estimate loses its input;
- the hand-held capture within ±45° used to measure what regularization costs at ordinary angles.
Both captures record all five roll estimates side by side. The subscript in
attitude_reg_deg[i] is an index into the firmware’s coefficient table rather
than a value, and the order is not monotone — the repository’s manifest lists
which index carries which value of .
All datasets are provided as HDF5 files and can be downloaded and opened with EmbedStudio or another compatible HDF5 tool.
Frequently Asked Questions
Why does accelerometer roll become unstable near 90 degrees of pitch?
Because roll is the direction of the acceleration vector's projection onto the sensor's YZ plane, and that projection shrinks to nothing as gravity lines up with the X axis. On the board measured here, at a pitch of minus 88.4 degrees the projection was 0.026 g, about one thirty-eighth of the vector it came from, while the noise on it was around 0.008 g. The direction of a vector that short is barely determined, so the calculated roll swung across 59 degrees while the pitch moved by 1.4 degrees. It is a property of the geometry, not a fault in the sensor.
Can regularization fix the accelerometer roll singularity?
No. It makes the estimator better behaved but adds no information. Replacing the roll denominator with the square root of a_z squared plus mu times a_x squared stops it collapsing to zero, which cuts the fluctuation, but when gravity lines up with the X axis the accelerometer still cannot see rotation about that axis. The measured standard deviation near the singular orientation fell from 14.8 degrees at mu equals zero to 0.61 degrees at mu equals 0.1, a factor of 24, and every one of those five answers described the same orientation.
What value of the regularization coefficient should I use?
It depends on the operating range, and the worst-case error is a closed-form number you can read off before measuring anything. Within plus or minus 45 degrees of roll and pitch, mu equals 0.001 costs at most 0.029 degrees and mu equals 0.01 costs at most 0.28 degrees. Within plus or minus 85 degrees the same two coefficients cost 15.5 and 44 degrees. A value around 0.001 is a reasonable default for moderate ranges, because it is a negligible error where the equation already works and still visibly steadies it where it does not.
Does the regularization term change the roll calculation at small angles?
Almost not at all. Over a twelve and a half second recording covering plus or minus 45 degrees of roll and pitch, the median difference from the unmodified estimate was 0.0001 degrees at mu equals 0.0001, 0.0008 degrees at mu equals 0.001, 0.005 degrees at mu equals 0.01 and 0.030 degrees at mu equals 0.1. The differences track the coefficient by a factor of ten per decade, exactly as the closed-form error predicts.
Why does the regularized roll equation need the sign of a_z?
Because a square root is never negative, so a denominator without the sign would confine roll to minus 90 to plus 90 degrees and the estimator could never report a board tipped past vertical. Multiplying the square root by the sign of a_z puts the result back in the correct quadrant and keeps the full minus 180 to plus 180 degree range that the original two-argument arctangent has. Dropping it is a silent halving of the output range.
Is the accelerometer roll singularity the same thing as gimbal lock?
It is the same kind of problem, arising from the same place. Roll and pitch are a two-angle description of a direction, and at pitch equal to plus or minus 90 degrees that description has a coordinate singularity where roll stops being defined. What is specific to the accelerometer is that the measurement itself carries no information about rotation around gravity, so no change of parameterisation recovers it. A second sensor does.
What fixes the problem properly?
Another sensor. The accelerometer measures the direction of one vector, and rotation about that vector leaves the measurement unchanged, so the information is genuinely absent rather than merely badly conditioned. A gyroscope measures rotation rate directly and is not blind at that orientation, which is why the next step is combining the two.
Source Code
The firmware and supporting files for this experiment are available here:
View experiment repository