
The Observer Effect in Embedded Debugging: When Measurement Changes the System
Why printf and breakpoints change the behaviour they are meant to reveal, and how low-intrusion tracing provides a different approach.
Published
In physics, measuring a system can influence the result. Embedded debugging has a similar problem: the tools we use to observe firmware often change the behaviour we are trying to understand.
The oldest debugging tool in firmware is printf. In real-time systems, it is
also one of the most misleading. The act of reporting the state changes the
state.
What a printf actually costs
A single formatted line over a 115200 baud UART is roughly 40 characters, requiring about 3.5 ms of transmission time. In a control loop running at 10 kHz — 100 µs per iteration — that one message consumes roughly thirty-five loop periods.
But transmission is only part of the cost.
Even when output is buffered and transferred using DMA:
- Formatting itself consumes CPU cycles and may involve expensive operations such as division.
- Buffer management requires synchronization, sometimes disabling interrupts.
- When buffers fill, the system must either block or drop data.
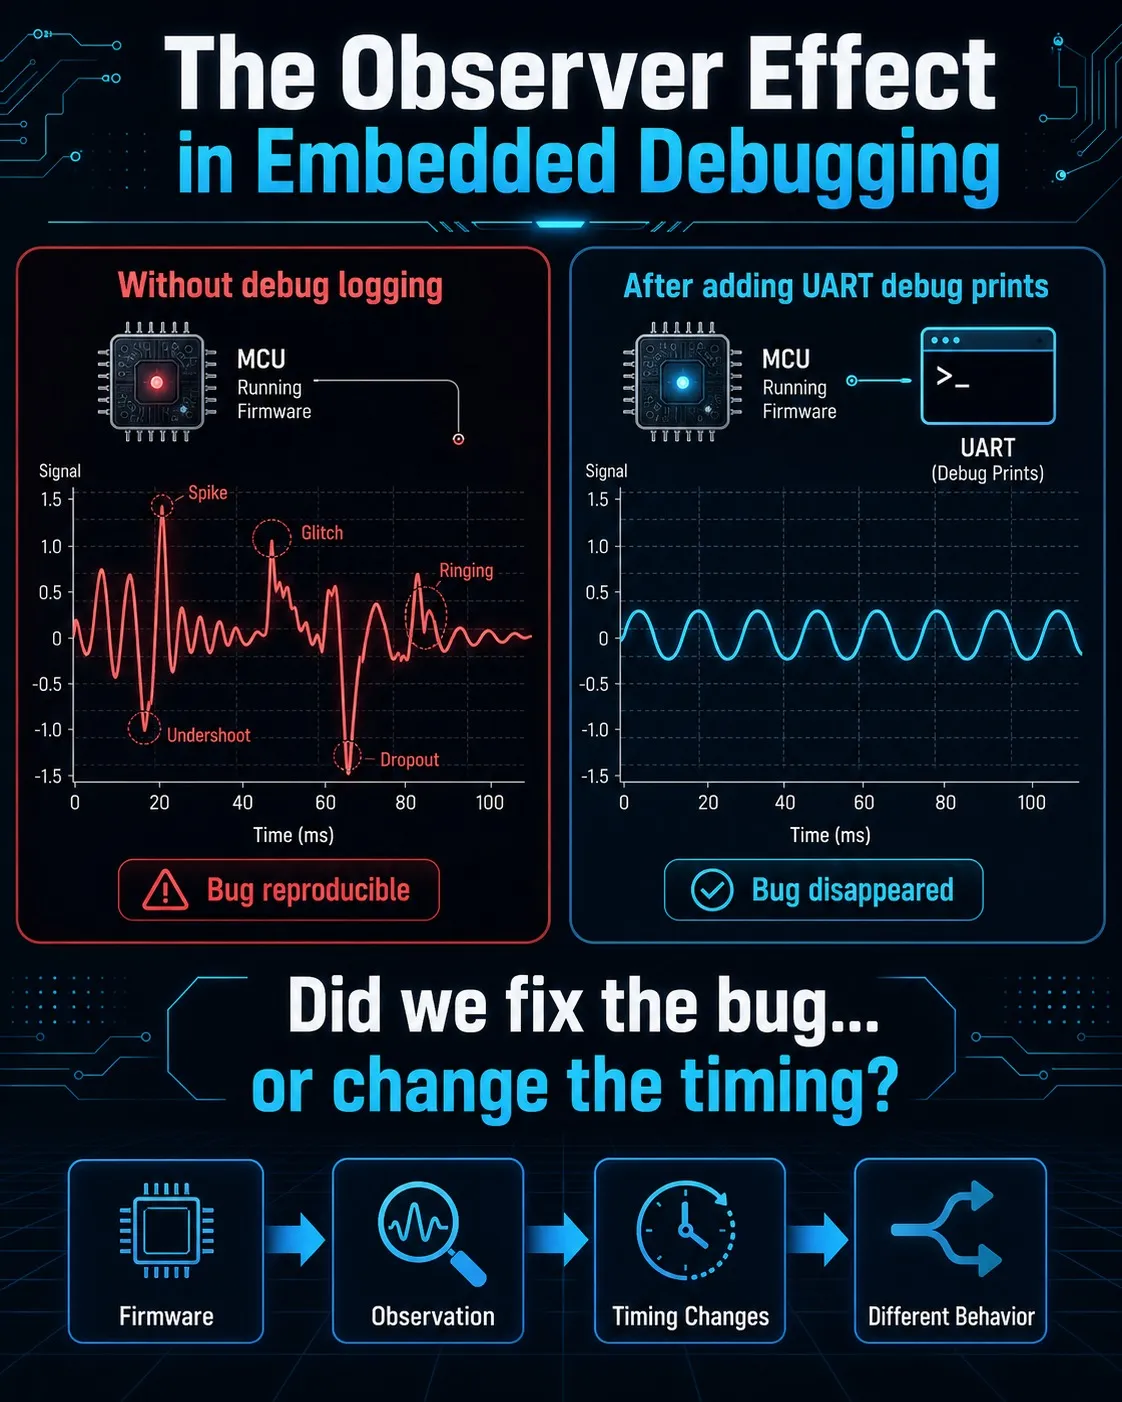
The result is a familiar embedded debugging paradox: the bug disappears when logging is enabled, or appears only after logging is removed.
The timing was part of the system behaviour. The observation changed the experiment.
Breakpoints are an even stronger intervention
A breakpoint does not merely slow the system down — it freezes part of it.
A motor under closed-loop control does not know that the CPU has stopped. The last commanded duty cycle remains applied to the power stage. A pause at the wrong moment can leave the system in a state that would never occur during normal operation.
Peripherals may continue running unless explicitly configured to freeze on halt: timers continue counting, DMA transfers progress, and watchdogs may expire.
The state visible after stopping is often not the state the system would have reached naturally.
Observing without interrupting
A different approach is to leave the firmware untouched and observe the running system from the outside.
On ARM Cortex-M devices, the debug infrastructure can access memory while the processor continues executing. SRAM contents can be inspected without inserting instrumentation code or stopping the application.
There is still a cost: debug accesses share system resources with the CPU and peripherals. However, for typical tracing rates, this overhead is usually negligible compared with the cost of formatting and transmitting debug data from the firmware itself.
More importantly, the nature of the cost changes.
-
Sampling rate becomes a tooling decision, not a firmware decision. Increasing visualization frequency consumes debug bandwidth rather than CPU execution time.
-
The firmware remains unchanged. No trace macros, no additional communication protocol, and no special debug build are required.
This removes an entire category of timing-related Heisenbugs: the system being observed can be the same system that runs in production.
Turning memory into meaningful data
Reading memory is only useful if we understand what those addresses represent.
Fortunately, the firmware build already contains this information. The ELF file and DWARF debug data describe variables, addresses, data types, structures, and array layouts.
The workflow becomes simple:
- Load the firmware description.
- Select variables by name.
- Observe their values while the application keeps running.
No instrumentation code. No serial protocol. No manually maintained address lists that become invalid after every linker change.
This is the idea behind EmbedStudio: making embedded systems observable while preserving the behaviour of the system being observed.
The goal is not just faster debugging. It is reducing the distance between the real-time system and the engineer trying to understand it.